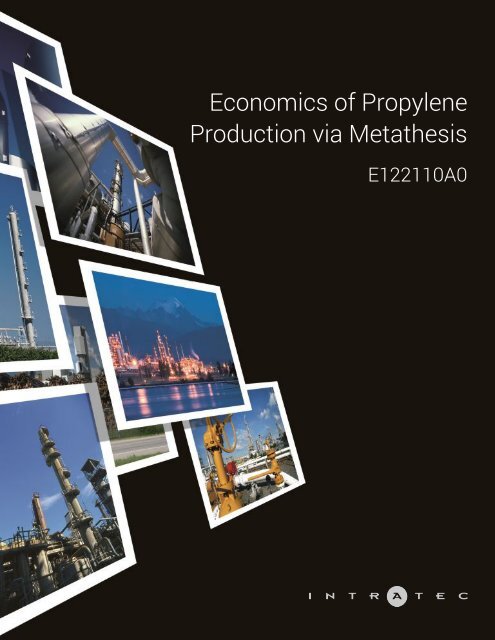
Economics of Propylene Production via Metathesis
This report presents the economics of Polymer Grade (PG) Propylene production from ethylene and raffinate-2 using a metathesis process. The process examined is similar to CB&I Lummus Technology's Olefins Conversion Technology (OCT). This report examines one-time costs associated with the construction of a United States-based plant and the continuing costs associated with the daily operation of such a plant. Know more about this and other Propylene reports at: www.intratec.us/products/propylene-production-processes
This report presents the economics of Polymer Grade (PG) Propylene production from ethylene and raffinate-2 using a metathesis process. The process examined is similar to CB&I Lummus Technology's Olefins Conversion Technology (OCT). This report examines one-time costs associated with the construction of a United States-based plant and the continuing costs associated with the daily operation of such a plant. Know more about this and other Propylene reports at: www.intratec.us/products/propylene-production-processes

You also want an ePaper? Increase the reach of your titles
YUMPU automatically turns print PDFs into web optimized ePapers that Google loves.
<strong>Economics</strong> <strong>of</strong> <strong>Propylene</strong><br />
<strong>Production</strong> <strong>via</strong> <strong>Metathesis</strong><br />
E122110A0
E122110A0<br />
<strong>Economics</strong> <strong>of</strong> <strong>Propylene</strong> <strong>Production</strong> <strong>via</strong> <strong>Metathesis</strong><br />
Industrial Process Report<br />
ABSTRACT<br />
This report presents the economics <strong>of</strong> Polymer Grade (PG) <strong>Propylene</strong> production from ethylene and raffinate-2<br />
using a metathesis process. The process examined is similar to CB&I Lummus Technology's Olefins Conversion<br />
Technology (OCT). In this process, Polymer Grade <strong>Propylene</strong> is produced through a metathesis reaction <strong>of</strong><br />
ethylene with 2-butene, present in raffinate-2 feedstock.<br />
This report examines one-time costs associated with the construction <strong>of</strong> a United States-based plant and the<br />
continuing costs associated with the daily operation <strong>of</strong> such a plant. More specifically, it discusses:<br />
* Capital Investment, broken down by:<br />
- Fixed capital required for production units (ISBL); infrastructure (OSBL) and contingency<br />
- Working capital and costs incurred during industrial plant commissioning and start-up<br />
* <strong>Production</strong> cost, broken down by:<br />
- Manufacturing variable costs (raw materials, utilities)<br />
- Manufacturing fixed costs (maintenance costs, operating charges, plant overhead, local taxes and insurance)<br />
- Depreciation and corporate overhead costs<br />
* <strong>Production</strong> cost history (4-year timeframe)<br />
* Raw materials consumption, products generation and labor requirements<br />
* Process block flow diagram and description <strong>of</strong> industrial site installations (production units and infrastructure)<br />
* Multi-regional fixed capital analysis (United States, China, Germany, Saudi Arabia, Singapore, Japan and Brazil)<br />
This report was developed based essentially on the following reference(s):<br />
(1) US Patent 8440874, issued to Lummus Technology and BASF in 2013<br />
(2) US Patent 20050124839, issued to Lummus Technology in 2005<br />
Keywords: PG <strong>Propylene</strong>, Olefins Disproportionation, Lummus OCT, Olefins <strong>Metathesis</strong>, Phillips Triolefin, Propene,<br />
Ethene, Butylene, On-Purpose <strong>Propylene</strong> <strong>Production</strong>
TERMS OF USE<br />
Data, information, tools, analyses and/or models herein presented are prepared on the basis <strong>of</strong> publicly available<br />
information and non-confidential information disclosed by third parties. Third parties, including, but not limited to<br />
technology licensors, trade associations or marketplace participants, may have provided some <strong>of</strong> the information<br />
on which the analyses or data are based.<br />
The data, information, tools, analyses and/or models herein presented are developed independently by Intratec<br />
and, as such, are the opinion <strong>of</strong> Intratec and do not represent the point <strong>of</strong> view <strong>of</strong> any third parties nor imply in any<br />
way that they have been approved or otherwise authorized by third parties that are mentioned in this report.<br />
Intratec conducts analyses and prepares reports and tools for readers in conformance with generally accepted<br />
pr<strong>of</strong>essional standards. Although the statements in this report are derived from or based on several sources that<br />
Intratec believe to be reliable, Intratec does not guarantee their accuracy, reliability, or quality; any such<br />
information, or resulting analyses, may be incomplete, inaccurate or condensed. All estimates included in this<br />
report are subject to change without notice. This report is for informational purposes only and is not intended as<br />
any recommendation <strong>of</strong> investment.<br />
Reader agrees it will not, without prior written consent <strong>of</strong> Intratec, represent, directly or indirectly, that its products<br />
have been approved or endorsed by the other parties. In no event shall Intratec, its employees, representatives,<br />
resellers or distributors be liable to readers or any other person or entity for any direct, indirect, special, exemplary,<br />
punitive, or consequential damages, including lost pr<strong>of</strong>its, based on breach <strong>of</strong> warranty, contract, negligence, strict<br />
liability or otherwise, arising from the use <strong>of</strong> this report, whether or not they or it had any knowledge, actual or<br />
constructive, that such damages might be incurred.<br />
Reader agrees that Intratec retains all rights, title and interest, including copyright and other proprietary rights, in<br />
this report and all material, including but not limited to text, images, and other digital files, provided or made<br />
available as part <strong>of</strong> this report. The reader further agrees to refrain from any general release <strong>of</strong> the information<br />
presented in this report, so as to constitute passage <strong>of</strong> title into the public domain or otherwise jeopardize<br />
common law or statutory copyright.
TABLE OF CONTENTS<br />
ABOUT THIS REPORT......................................................................................................................................................................5<br />
Study Objective............................................................................................................................................................................ 5<br />
Report Overview...........................................................................................................................................................................5<br />
ABOUT PROPYLENE........................................................................................................................................................................ 6<br />
Description....................................................................................................................................................................................6<br />
Applications.................................................................................................................................................................................. 6<br />
PG <strong>Propylene</strong> <strong>Production</strong> Pathways Diagram.......................................................................................................................7<br />
PROCESS OVERVIEW...................................................................................................................................................................... 8<br />
Product(s) Generated................................................................................................................................................................. 8<br />
Process Inputs............................................................................................................................................................................. 8<br />
Physico-Chemistry Highlights.................................................................................................................................................. 9<br />
INDUSTRIAL SITE.......................................................................................................................................................................... 10<br />
Introduction................................................................................................................................................................................10<br />
<strong>Production</strong> Units Description..................................................................................................................................................11<br />
Site Infrastructure Description............................................................................................................................................... 15<br />
Key Process Input and Output Figures.................................................................................................................................17<br />
Labor Requirements.................................................................................................................................................................17<br />
CAPITAL INVESTMENT.................................................................................................................................................................18<br />
Fixed Capital...............................................................................................................................................................................19<br />
Working Capital......................................................................................................................................................................... 24<br />
Additional Capital Requirements........................................................................................................................................... 24<br />
Total Capital Investment Summary...................................................................................................................................... 25<br />
PRODUCTION COSTS....................................................................................................................................................................26<br />
Manufacturing Variable Costs................................................................................................................................................28<br />
Manufacturing Fixed Costs.....................................................................................................................................................29<br />
Corporate Overhead..................................................................................................................................................................29<br />
Depreciation............................................................................................................................................................................... 30<br />
Total <strong>Production</strong> Cost.............................................................................................................................................................. 30
<strong>Production</strong> Cost History.......................................................................................................................................................... 31<br />
PROCESS ECONOMICS SUMMARY...........................................................................................................................................32<br />
LABOR WAGE RATES & PRICING BASIS...................................................................................................................................34<br />
REFERENCES..................................................................................................................................................................................36<br />
ANALYSIS METHODOLOGY......................................................................................................................................................... 38<br />
Introduction................................................................................................................................................................................38<br />
Bibliographical Research.........................................................................................................................................................38<br />
Process Overview......................................................................................................................................................................38<br />
Examining an Industrial Site................................................................................................................................................... 40<br />
Capital Investment Estimating...............................................................................................................................................41<br />
<strong>Production</strong> Cost Estimating....................................................................................................................................................46<br />
Product Value Estimating........................................................................................................................................................48<br />
Estimates Limitation................................................................................................................................................................ 49<br />
ABOUT INTRATEC..........................................................................................................................................................................50<br />
Our Business..............................................................................................................................................................................50<br />
Our Reports................................................................................................................................................................................ 50<br />
APPENDIX 1: FIXED CAPITAL REGIONAL COMPARISON..................................................................................................... 52<br />
APPENDIX 2: INTRATEC CHEMICAL PLANT CONSTRUCTION INDEX...............................................................................53
ABOUT THIS REPORT<br />
Study Objective<br />
This report presents the economics <strong>of</strong> Polymer Grade (PG) <strong>Propylene</strong> production from ethylene and raffinate-2<br />
using a metathesis process. The process examined is similar to CB&I Lummus Technology's Olefins Conversion<br />
Technology (OCT).<br />
The primary objective <strong>of</strong> this study is to explain the cost structure <strong>of</strong> the aforementioned process, encompassing<br />
capital investment and production cost figures.<br />
The process design and economics in this report are based on an industrial facility with a nominal production<br />
capacity <strong>of</strong><br />
per year, a capacity that is globally competitive.<br />
In addition, the economic assessment, developed for the period<br />
, assumes the construction <strong>of</strong> a United<br />
States-based industrial facility that includes the infrastructure typically required for such a project.<br />
Report Overview<br />
This report is structured into eight main parts which follow a logical sequence. Each <strong>of</strong> these parts is described<br />
below.<br />
By way <strong>of</strong> introduction, the first part – the current chapter – briefly explains the report itself, its structure and<br />
objective. Readers are encouraged to spend a few minutes reading this chapter, so as to make the most <strong>of</strong> the<br />
study.<br />
In the second part, About <strong>Propylene</strong>, the reader will learn the basics <strong>of</strong> <strong>Propylene</strong> itself. This chapter also covers its<br />
applications and major production pathways.<br />
The third part, Process Overview, presents basic aspects <strong>of</strong> the process studied: products generated, process<br />
inputs, and physico-chemistry highlights.<br />
The fourth part, Industrial Site, describes an industrial plant based on the process under analysis, in terms <strong>of</strong> the<br />
production units and infrastructure required. This technical analysis underlies the entire study.<br />
The fifth part, Capital Investment, presents all capital costs associated with the process examined, from design and<br />
erection <strong>of</strong> an industrial site to plant startup.<br />
Operational Expenses <strong>of</strong> the process are examined in the sixth part. Ongoing costs related to the operation <strong>of</strong> a unit<br />
based on the process are studied, including manufacturing fixed costs, manufacturing variable costs, depreciation<br />
and corporate overhead.<br />
The seventh part, Process <strong>Economics</strong> Summary, summarizes all economic figures presented throughout the report.<br />
Finally, to address any questions or concerns about the methodologies and procedures adopted in the<br />
development <strong>of</strong> this report, the reader is referred to the eighth part, Analysis Methodology.<br />
5
ABOUT PROPYLENE<br />
Description<br />
<strong>Propylene</strong> is an unsaturated organic compound with the chemical formula C3H6. It has one double bond and is<br />
the second simplest member <strong>of</strong> the alkene class <strong>of</strong> hydrocarbons, as well as in terms <strong>of</strong> natural abundance.<br />
At room temperature, <strong>Propylene</strong> is a colorless gas. It is a low-boiling, flammable, and highly volatile gas. Because<br />
the primary hazard associated with <strong>Propylene</strong> is its flammability, precautions must be taken to avoid fire hazards<br />
in the handling <strong>of</strong> this gas.<br />
Commercially, propylene is traded in three grades:<br />
* Polymer Grade (PG): min. 99.5% <strong>of</strong> purity<br />
* Chemical Grade (CG): 90-96% <strong>of</strong> purity<br />
* Refinery Grade (RG): 50-70% <strong>of</strong> purity<br />
Applications<br />
<strong>Propylene</strong> is a major industrial chemical intermediate that serves as one <strong>of</strong> the building blocks for an array <strong>of</strong><br />
chemical and plastic products, and was also the first petrochemical employed on an industrial scale. The<br />
<strong>Propylene</strong> market is dominated by the PG <strong>Propylene</strong>, which is mainly used in polypropylene production. PG<br />
<strong>Propylene</strong> is also used in propylene oxide manufacture.<br />
The other grades <strong>of</strong> <strong>Propylene</strong> are used for different applications. CG propylene is used extensively for most<br />
chemical derivatives (e.g., oxo-alcohols, acrylonitrile, etc.). RG <strong>Propylene</strong>, which is obtained from refinery<br />
processes, is mainly used in liquefied petroleum gas (LPG) for thermal purposes or as an octane-enhancing<br />
component in motor gasoline. It can also be used in some chemical syntheses (e.g., cumene or isopropanol). The<br />
most significant market for RG <strong>Propylene</strong> is the conversion to PG or CG <strong>Propylene</strong>.<br />
6
PG <strong>Propylene</strong> <strong>Production</strong> Pathways Diagram<br />
<strong>Propylene</strong>, more specifically PG propylene, can be manufactured from several raw materials. Globally, the largest<br />
volume <strong>of</strong> <strong>Propylene</strong> is produced from NGL (Natural Gas Liquids) or naphtha in steam cracking processes, which<br />
generates ethylene as well. The following chart presents different pathways for <strong>Propylene</strong> production.<br />
7
PROCESS OVERVIEW<br />
This chapter presents technical aspects <strong>of</strong> the Polymer Grade (PG) <strong>Propylene</strong> production from ethylene and<br />
raffinate-2 using a metathesis process.<br />
More specifically, the current chapter describes the products generated, the process inputs, and highlights about<br />
the physico-chemistry related to this process.<br />
Product(s) Generated<br />
In addition to PG <strong>Propylene</strong>, the process under analysis generates the by-product described below.<br />
* Fuel<br />
In the present study, it was assumed that light ends and heavy ends separated from the propylene produced would<br />
be sold as fuel to other nearby facilities. The light end stream consists <strong>of</strong> a small vent stream containing light<br />
paraffins and a small amount <strong>of</strong> unconverted ethylene that is purged to avoid the build-up <strong>of</strong> impurities in the<br />
process.<br />
The heavy ends stream is mainly composed <strong>of</strong> butanes present in the raffinate-2 feed and C4+ by-products<br />
generated in side reactions.<br />
Process Inputs<br />
Raw Material(s)<br />
* Ethylene<br />
Commercial ethylene, a colorless, low-boiling, flammable gas with a sweet odor, has the molecular formula <strong>of</strong><br />
C2H4. Usually, ethylene is produced in steam crackers. It is stored in a liquid state under high pressure or at low<br />
temperatures.<br />
While ethylene forms an explosive mixture with air and oxidizing agents, its classification and labelling is focused<br />
on its flammability and explosive properties. There has been no clear evidence that exposure to ethylene has a<br />
toxic effect on humans.<br />
* Raffinate-2<br />
Raffinate-2 is a C4 residual stream primarily consisting <strong>of</strong> 1-butene, 2-butenes, and butanes. It is obtained<br />
following the separation <strong>of</strong> 1,3-butadiene and isobutylene from mixed C4s stream (or crude C4s), which is one <strong>of</strong><br />
the products <strong>of</strong> the naphtha steam cracking processes.<br />
In a metathesis process, raffinate-2 is the most common source <strong>of</strong> butenes. 1-butene is isomerized to 2-butenes<br />
and 2-butenes react with ethylene to form propylene. The raffinate-2 used as raw material in the process under<br />
discussion is composed <strong>of</strong> 80 wt% n-butenes.<br />
8
Physico-Chemistry Highlights<br />
<strong>Metathesis</strong> is a reversible reaction between two olefins, in which the double bonds are broken and then reformed<br />
to form new olefin products. In order to produce propylene by metathesis, a molecule <strong>of</strong> 2-butene and a molecule<br />
<strong>of</strong> ethylene are combined in the presence <strong>of</strong> a tungsten oxide catalyst to form two molecules <strong>of</strong> propylene, as<br />
indicated in equation (1).<br />
Other reactions that occur in the metathesis reactor are also indicated below – see equations (2) and (3). All<br />
reactions are essentially isothermal. Note that no reaction between 1-butene and ethylene was presented. This<br />
reaction is non-productive, occupying catalyst sites but producing no product. In order to increase propylene<br />
yields, a magnesium oxide co-catalyst is added to the metathesis reactor to induce a double bond isomerization<br />
reaction, thus causing the shift from 1-butene to 2-butene.<br />
If isobutene is also present in the C4 hydrocarbons mixture, propylene yield will also be reduced due to the<br />
occurrence <strong>of</strong> two isobutene side reactions, as indicated in equations (4) and (5).<br />
(1) ethylene + 2-butene --> 2 (propylene)<br />
(2) 1-butene + 2-butene --> propylene + 2-pentene<br />
(3) 1-butene + 1-butene --> ethylene + 3-hexene<br />
(4) isobutene + 2-butene --> propylene + 2-methyl 2-butene<br />
(5) isobutene + 1-butene --> ethylene + 2-methyl 2-pentene<br />
9
INDUSTRIAL SITE<br />
This chapter presents all installations that comprise an industrial site for Polymer Grade (PG) <strong>Propylene</strong> production<br />
from ethylene and raffinate-2 using a metathesis process. The process examined is similar to CB&I Lummus<br />
Technology's Olefins Conversion Technology (OCT).<br />
The present study was mainly based on:<br />
(1) US Patent 8440874, issued to Lummus Technology and BASF in 2013<br />
(2) US Patent 20050124839, issued to Lummus Technology in 2005<br />
Introduction<br />
The information presented in this chapter is based on commonly utilized concepts related to the type <strong>of</strong><br />
installations found within a typical industrial site. These concepts include:<br />
* <strong>Production</strong> units. Also known as inside battery units, these installations comprise all main processing units <strong>of</strong><br />
the site necessary to the manufacturing <strong>of</strong> products. These units are located Inside the Battery Limits (ISBL).<br />
* Infrastructure. Also known as outside battery units or <strong>of</strong>fsite facilities, these installations do not directly enter<br />
into the manufacturing <strong>of</strong> a product. They are support buildings, auxiliary units used for providing and distributing<br />
utilities and storage facilities. These units are located Outside the Battery Limits (OSBL).<br />
<strong>Production</strong> Units<br />
<strong>Production</strong> units form the core <strong>of</strong> an industrial site. Comprising the site’s battery limits (ISBL), such units may be<br />
numerous, complex and involve several pieces <strong>of</strong> equipment. In this context, the most didactic approach to<br />
presenting all production units <strong>of</strong> a site is through the use <strong>of</strong> a block flow diagram. Visual information is, in fact, the<br />
clearest way to present a chemical process and is least likely to be misinterpreted.<br />
In general, these diagrams consist <strong>of</strong> a series <strong>of</strong> blocks, representing unit operations or groups <strong>of</strong> equipment,<br />
connected by input and output streams. In fact, there are no strict standards according to which such diagrams<br />
are made.<br />
To facilitate the presentation <strong>of</strong> the production units under analysis, Intratec developed a block flow diagram<br />
according to the following standards:<br />
* Raw materials consumed are represented by blocks in gray<br />
* Main process areas are represented by blocks in light blue<br />
* Products and by-products generated are represented by blocks in dark blue<br />
* Main process streams are represented by lines connecting the blocks<br />
10
The figure below illustrates the type <strong>of</strong> information presented in the block flow diagram, according to such<br />
standards.<br />
The process areas represented (in light blue) correspond to what is defined as a “functional unit”. Basically, a<br />
“functional unit” is a significant step in the production process in which a particular physico-chemical operation (i.<br />
e., distillation, reaction, evaporation) occurs. According to this definition, a given functional unit is not associated<br />
with a single piece <strong>of</strong> equipment, but rather with a group <strong>of</strong> equipment and ancillaries required to perform a<br />
particular operation.<br />
Blocks representing process areas also show key technical parameters related to these areas, including: highest<br />
operating temperature and pressure, representative material <strong>of</strong> construction, and other parameters.<br />
As to the process streams represented, there is an indication <strong>of</strong> their phase when leaving/entering a block. Also,<br />
such streams provide a global material balance <strong>of</strong> the process, normalized by the mass flow rate <strong>of</strong> the product<br />
considered in the analysis. In other words, the number near each stream represents the ratio between its mass<br />
flow rate and the output flow rate <strong>of</strong> the product under analysis.<br />
It is worth noting that areas having no significant impact on the economics <strong>of</strong> the process may not be included in<br />
the diagram. Similarly, some streams may also not be represented. Nevertheless, the diagram presented is still<br />
extremely useful in providing readers with an overall understanding and “feeling” <strong>of</strong> the process studied.<br />
For more information on how the process examined was divided into functional units, the reader is referred to the<br />
section on <strong>Production</strong> Units in the “Analysis Methodology” chapter.<br />
Site Infrastructure<br />
Infrastructure requirements comprise the <strong>of</strong>fsite facilities, or the units located Outside the Battery Limits (OSBL).<br />
The OSBL usually have a significant impact on the capital cost estimates associated with any new industry<br />
venture. This impact is largely dictated by, among other things: specific conditions where the industrial site will be<br />
erected; the level <strong>of</strong> integration the new site will have with nearby facilities or industrial complexes; and assurance<br />
and promptness in the supply <strong>of</strong> chemicals.<br />
<strong>Production</strong> Units Description<br />
The production units related to the process under analysis are described based on the above explanation. On the<br />
next page, a block flow diagram illustrates the production units examined.<br />
11
12
The process under analysis is briefly described below. For clarity, the description was divided according to the<br />
process areas indicated in the diagram.<br />
It is important to mention that some aspects <strong>of</strong> the process examined are either industrial secrets, not published in<br />
patents, or have changed and were not reported in the literature at the time this report was developed. That being<br />
the case, the design herein presented is partially based on Intratec process synthesis knowledge such that there<br />
may be some differences between the industrial process actually employed and the process described in this<br />
study. Nevertheless, the design presented suitably represents the technology examined in sufficient detail to<br />
estimate the economics <strong>of</strong> the technology within the degree <strong>of</strong> accuracy expected from conceptual evaluations.<br />
13
14
Site Infrastructure Description<br />
The infrastructure requirements <strong>of</strong> the industrial site examined are defined based on the following assumptions:<br />
The figure below illustrates the configuration <strong>of</strong> the industrial complex that encompasses the industrial process<br />
examined. The <strong>of</strong>fsite facilities considered in the analysis (i.e., areas 90, 91 and 92) were defined according to the<br />
aforementioned assumptions.<br />
15
Finally, <strong>of</strong>fsite facilities were divided into areas according to their type/function. These areas are listed below, as<br />
well as the major equipment, systems and facilities included in each <strong>of</strong> them.<br />
16
Key Process Input and Output Figures<br />
In accordance with the block flow diagram and the global material balance previously presented, the following<br />
tables show key process indicators <strong>of</strong> the technology examined in this report. These indicators reflect the raw<br />
material consumption and the products generation rates per metric ton <strong>of</strong> PG <strong>Propylene</strong> produced.<br />
Raw Materials Consumption<br />
RAW MATERIAL<br />
CONSUMPTION PER METRIC TON OF PRODUCT<br />
UNIT<br />
Products Generation<br />
PRODUCT<br />
GENERATION PER METRIC TON OF PRODUCT<br />
UNIT<br />
It should be noted that estimation <strong>of</strong> raw material requirements in the conceptual design phase is usually<br />
reasonably accurate but tends to be somewhat understated compared to real operations. Losses from vessel<br />
vents, unscheduled equipment, inerting systems, physical property inaccuracies, startup, shutdown and other<br />
process operations not typically addressed in this phase may increase raw materials consumption.<br />
Labor Requirements<br />
The following table presents the number <strong>of</strong> operators per shift required to run the equipment <strong>of</strong> the process<br />
examined, as well as the personnel per shift required to directly supervise the operating labor.<br />
Labor Requirements<br />
PERSONNEL REQUIRED<br />
WORKERS PER SHIFT<br />
Operators<br />
Supervisors<br />
17
CAPITAL INVESTMENT<br />
This chapter details all capital costs associated with Polymer Grade (PG) <strong>Propylene</strong> production from ethylene and<br />
raffinate-2 using a metathesis process, from design and erection <strong>of</strong> an industrial site to plant startup.<br />
The costs that comprise the total capital investment are grouped under three main headings:<br />
* Total fixed capital. Investment necessary to the erection <strong>of</strong> the industrial plant itself<br />
* Working capital. Funds required for getting the plant into operation, and meeting subsequent obligations<br />
* Additional capital requirements. Costs incurred during industrial plant commissioning and start-up<br />
The graph below illustrates the composition <strong>of</strong> total capital investment.<br />
The estimates included in this chapter are based on the following assumptions:<br />
* Plant nominal capacity: <strong>of</strong> PG <strong>Propylene</strong> per year<br />
* Industrial plant location: United States<br />
* Construction on a cleared, level site<br />
* Period <strong>of</strong> analysis:<br />
* IC Index at the period <strong>of</strong> analysis:<br />
18
The IC Index stands for Intratec Chemical Plant Construction Index, an indicator published monthly by Intratec to<br />
scale capital costs from one time period to another. This index reconciles the price trends <strong>of</strong> fundamental<br />
components <strong>of</strong> chemical plant construction such as labor, material and energy, providing meaningful historical<br />
and forecast data for our readers and clients. For more information about the IC Index, the reader is referred to<br />
Appendix II – Intratec Chemical Plant Construction Index.<br />
In the next pages capital costs are described in further detail, and estimates calculated are presented. For more<br />
information on the methods employed for estimating the costs presented, the reader is referred to the “Analysis<br />
Methodology” chapter.<br />
Fixed Capital<br />
Fixed capital is related to the erection <strong>of</strong> the industrial site itself. Also referred as “capital expenditures” (CAPEX),<br />
fixed capital constitutes the fraction <strong>of</strong> the capital investment which is depreciable.<br />
It includes Total Process Capital (TPC) and Project Contingency, as described below.<br />
Total Process Capital encompasses the investment required for the construction <strong>of</strong>: (1) process areas previously<br />
presented in the "Process Block Flow Diagram" (ISBL investment); (2) the site infrastructure (OSBL Investment),<br />
also previously discussed; and (3) a process contingency reflecting technical uncertainties associated with limited<br />
design data, which may incur capital cost increases (e.g., additional equipment not included in the preliminary<br />
design).<br />
Project Contingency, on the other hand, is included to cover the costs which may arise as the project evolves.<br />
Such costs include: project errors or incomplete specifications, labor costs changes, strikes, problems caused by<br />
weather; inflation, etc.<br />
The table below summarizes all items that make up the fixed capital cost:<br />
Fixed Capital Summary (USD Million)<br />
COMPONENT LOWER LIMIT UPPER LIMIT ESTIMATED %<br />
Inside battery limits (ISBL)<br />
Process contingency (<br />
<strong>of</strong> ISBL)<br />
Outside battery limits (OSBL)<br />
Total process capital (TPC)<br />
Project contingency (<br />
<strong>of</strong> TPC)<br />
TOTAL FIXED CAPITAL<br />
The above table also presents the upper and lower limits for the fixed capital figures, according to the accuracy<br />
range expected from conceptual evaluations presented in this report. The presented range is associated with a<br />
confidence level <strong>of</strong> 90%. In other words, a 90% confidence level means that, for every 100 times the project is<br />
actually implemented, the fixed capital required will fall into the range predicted with our estimates 90 times.<br />
19
For a better understanding <strong>of</strong> the costs involved in a new industrial venture, it is a common estimation practice to<br />
divide the fixed capital into direct process costs, indirect process costs and project contingency.<br />
Fundamentally, the direct process costs are all material and labor costs associated with the process equipment<br />
(from purchase to installation, including the required installation bulks). In short, the total direct cost represents the<br />
total installed equipment cost.<br />
The indirect costs account for field indirects, engineering costs, overhead, and contract fees. Indirect costs are<br />
defined by the American Association <strong>of</strong> Cost Engineers (AACE) Standard Terminology as those "costs which do<br />
not become a final part <strong>of</strong> the installation but which are required for the orderly completion <strong>of</strong> the installation."<br />
Accordingly, the chart below presents the fixed capital broken down by direct process costs, indirect costs and<br />
project contingency.<br />
Fixed Capital Composition<br />
The two charts in the next page detail the composition <strong>of</strong> direct field costs and indirect costs, respectively.<br />
20
Direct Costs Composition<br />
Indirect Costs Composition<br />
21
The next table presents the detailed fixed capital breakdown, based on the direct and indirect costs approach.<br />
Fixed Capital Breakdown<br />
COMPONENT<br />
Bare equipment (BEQ)<br />
Equipment setting<br />
Piping<br />
Civil<br />
Steel<br />
Instrumentation & control<br />
Electrical<br />
Insulation<br />
Painting<br />
Direct costs<br />
Engineering & procurement<br />
Construction material & indirects<br />
General & administrative overheads<br />
Contract fee<br />
Indirect costs<br />
MM USD<br />
% OF BEQ % OF TOTAL<br />
Total process capital (TPC)<br />
Project contingency (<br />
<strong>of</strong> TPC)<br />
TOTAL FIXED CAPITAL<br />
It is worth noting that the process contingency presented in the Table "Fixed Capital Summary" is included within<br />
each component listed in the table above.<br />
For further information about the components included in the fixed capital breakdown, reader is referred to the<br />
chapter “Analysis Methodology”.<br />
22
Of course, fixed capital is greatly impacted by the plant capacity assumed. In this context, a plant scale analysis<br />
was also performed in order to depict how the total capital required varies according to the plant capacity. The<br />
analysis results are presented in the next figure.<br />
Fixes Capital as Function <strong>of</strong> Plant Capacity (USD Million)<br />
Finally, from the analysis previously presented, the fixed capital per metric ton produced was calculated. This<br />
parameter allows readers to compare processes in regards to how capital intensive they are. Also, it can be used<br />
to measure the impact <strong>of</strong> plant scale on the total fixed capital and determine a minimum plant capacity that will be<br />
economically feasible.<br />
Fixed Capital per Unit <strong>of</strong> Plant Capacity (USD / Metric Ton)<br />
23
Working Capital<br />
For the purposes <strong>of</strong> this study, working capital is defined as the funds, in addition to the fixed capital, that a<br />
company must contribute to a project. Those funds must be adequate to bringing the plant into operation and<br />
meeting subsequent obligations.<br />
Working capital includes: raw materials inventory, products inventory, in-process inventory, supplies and stores,<br />
accounts receivable and accounts payable.<br />
The table below presents a breakdown <strong>of</strong> working capital. Unless otherwise indicated, all figures presented are in<br />
US million dollars (MM USD).<br />
Working Capital Breakdown (USD Million)<br />
COMPONENT<br />
ASSUMPTION<br />
MM USD<br />
%<br />
Accounts receivable<br />
day(s) <strong>of</strong> total production cost<br />
Accounts payable<br />
day(s) <strong>of</strong> operating cash cost + corporate overhead<br />
Net accounts receivable<br />
Raw materials inventory<br />
day(s) <strong>of</strong> raw materials costs<br />
Products inventory<br />
day(s) <strong>of</strong> total production cost<br />
In-process inventory<br />
day(s) <strong>of</strong> operating cash cost + corporate overhead<br />
Supplies and stores<br />
<strong>of</strong> annual operating labor and maintenance costs<br />
Cash on hand<br />
day(s) <strong>of</strong> operating cash cost + corporate overhead<br />
TOTAL WORKING CAPITAL<br />
Additional Capital Requirements<br />
Several expenses are incurred during commissioning and start-up <strong>of</strong> an industrial site. These expenses may be<br />
related to:<br />
* Employee training<br />
* Initial commercialization costs<br />
* Manufacturing inefficiencies and unscheduled plant modifications (equipment, piping, instruments, etc.)<br />
* Initial catalyst load in reactors<br />
* Purchase <strong>of</strong> technology through paid-up royalties or licenses<br />
* Land acquisition and site development<br />
Such additional costs are not addressed in most studies, but can become a significant expenditure. In the current<br />
analysis, these costs are represented by additional capital requirements.<br />
The table below presents a breakdown <strong>of</strong> additional capital investment.<br />
presented are in US million dollars (MM USD).<br />
Unless otherwise indicated, all figures<br />
24
Additional Capital Requirements Breakdown (USD Million)<br />
COMPONENT<br />
ASSUMPTION<br />
MM USD<br />
%<br />
Operator training<br />
day(s) <strong>of</strong> all labor costs<br />
Commercialization costs<br />
<strong>of</strong> annual operating cash cost + corporate overhead<br />
Initial catalyst load<br />
Start-up innefficiencies<br />
<strong>of</strong> annual operating cash cost + corporate overhead<br />
Unscheduled plant modifications<br />
<strong>of</strong> fixed capital<br />
Start-up costs<br />
Land & site development<br />
<strong>of</strong> fixed capital<br />
Prepaid royalties<br />
<strong>of</strong> fixed capital<br />
TOTAL ADDITIONAL CAPITAL<br />
Total Capital Investment Summary<br />
The table below summarizes all major capital costs discussed thus far, from the design and erection <strong>of</strong> an<br />
industrial site to plant startup.<br />
Capital Investment Summary<br />
COMPONENT<br />
Fixed capital<br />
Working capital<br />
Additional capital requirements<br />
TOTAL CAPITAL INVESTMENT<br />
MM USD<br />
%<br />
For more information about how the capital costs were estimated, the reader is referred to section on Capital<br />
Investment Estimating in the “Analysis Methodology” chapter.<br />
25
PRODUCTION COSTS<br />
This chapter details all ongoing costs required for Polymer Grade (PG) <strong>Propylene</strong> production from ethylene and<br />
raffinate-2 using a metathesis process. Also referred as operational expenditures (OPEX), these encompass costs<br />
associated with the plant operation, selling <strong>of</strong> products, and contribution to corporate functions (e.g.,<br />
administration and R&D activities). In the current analysis, the production cost was grouped under four main<br />
headings:<br />
* Manufacturing fixed costs. Operating costs directly tied to the plant capacity, but which do not change with the<br />
production level (i.e., operating labor, supervision labor, maintenance costs, plant overhead)<br />
* Manufacturing variable costs. Costs directly proportional to the actual production <strong>of</strong> the industrial site (i.e. raw<br />
materials and utilities consumption)<br />
* Depreciation. Refers to the decrease in value <strong>of</strong> industrial assets with passage <strong>of</strong> time<br />
* Corporate overhead. Corporate expenses related to administration, research and development, market and<br />
distribution<br />
It should be kept in mind that the sum <strong>of</strong> manufacturing fixed costs and manufacturing variable costs is referred<br />
as “cash cost”. The sum <strong>of</strong> cash cost with depreciation and corporate overhead, in turn, is referred to as<br />
“production cost”.<br />
The graph below illustrates the composition <strong>of</strong> production cost.<br />
26
The estimates included in this chapter are based on the following assumptions:<br />
* Industrial plant location: United States<br />
* Period <strong>of</strong> analysis:<br />
* Plant nominal capacity: <strong>of</strong> PG <strong>Propylene</strong> per year<br />
* Plant operating rate:<br />
The plant operating rate assumed leads to an annual production <strong>of</strong><br />
. It is important to<br />
mention that this rate does not represent any technology limitation; rather, it is an assumption based on usual<br />
industrial operating rates.<br />
In the next pages the production cost items are described in further detail, and estimates calculated are presented.<br />
For more information on the methods employed to estimate the costs presented, the reader is referred to the<br />
“Analysis Methodology” chapter.<br />
27
Manufacturing Variable Costs<br />
Variable costs change in direct proportion to changes in the production level. Such costs include raw materials<br />
and utilities (i.e., steam, electricity, fuel, and refrigeration).<br />
The next table displays the manufacturing variable costs.<br />
Manufacturing Variable Costs Breakdown<br />
COMPONENT<br />
QUANTITY PER MT PRICE USD/MT MM USD/YR<br />
%<br />
Gross raw materials cost<br />
By-product credits<br />
Net raw materials cost<br />
Net utilities cost<br />
MANUFACTURING VARIABLE COSTS<br />
All variable costs presented in this table are derived from unit consumptions, detailed in the previous chapter, and<br />
pricing information.<br />
28
Manufacturing Fixed Costs<br />
Manufacturing fixed costs are the costs primarily related to the production capacity <strong>of</strong> an industrial site, but which<br />
do not change with production volume. Such costs include maintenance costs, operating charges, plant overhead,<br />
local taxes and insurance.<br />
The table below presents a breakdown <strong>of</strong> manufacturing fixed costs.<br />
Manufacturing Fixed Costs Breakdown<br />
COMPONENT<br />
ASSUMPTION<br />
USD/MT<br />
MM USD/YR %<br />
Operating labor<br />
Supervision<br />
Maintenance cost<br />
operators/shift ;<br />
supervisors/shift ;<br />
<strong>of</strong> fixed capital<br />
USD/oper./h<br />
USD/sup./h<br />
Operating charges<br />
Plant overhead<br />
Property taxes and insurance<br />
<strong>of</strong> operating labor costs<br />
<strong>of</strong> operating labor and maintenance costs<br />
<strong>of</strong> fixed capital<br />
MANUFACTURING FIXED COSTS<br />
Corporate Overhead<br />
Corporate overhead is associated with costs incurred by a company’s head <strong>of</strong>fice such as general administrative<br />
costs, research and development activities, market and product distribution.<br />
The table below presents a breakdown <strong>of</strong> corporate overhead costs.<br />
Corporate Overhead Costs Breakdown<br />
COMPONENT<br />
ASSUMPTION<br />
USD/MT<br />
MM USD/YR %<br />
Administration costs<br />
<strong>of</strong> operating labor and maintenance costs<br />
Market & distribution<br />
<strong>of</strong> operating cash costs at full capacity<br />
Research & development<br />
<strong>of</strong> operating cash costs at full capacity<br />
CORPORATE OVERHEAD<br />
29
Depreciation<br />
Depreciation refers to the decrease in value <strong>of</strong> industrial assets with passage <strong>of</strong> time, primarily because <strong>of</strong> wear<br />
and tear. While not a true manufacturing cost, depreciation is considered to be a manufacturing expense for<br />
accounting purposes – it allows the recovery <strong>of</strong> the cost <strong>of</strong> an asset over a time period.<br />
In this study, the depreciation is USD per metric ton <strong>of</strong> PG <strong>Propylene</strong> produced.<br />
This calculation was based on the straight-line method and a project economic life <strong>of</strong> 10 years.<br />
Total <strong>Production</strong> Cost<br />
The table below summarizes all production cost components discussed thus far.<br />
<strong>Production</strong> Cost Summary<br />
COMPONENT<br />
Manufacturing variable costs<br />
Manufacturing fixed costs<br />
Operating cash costs<br />
Corporate overhead<br />
Depreciation<br />
TOTAL PRODUCTION COST<br />
USD/MT<br />
MM USD/YR %<br />
For more information about how the production cost components were estimated, the reader is referred to the<br />
section on <strong>Production</strong> Cost Estimating in the “Analysis Methodology” chapter.<br />
30
<strong>Production</strong> Cost History<br />
In order to provide a more consistent view <strong>of</strong> production economics, this analysis also compares the way in which<br />
production cost has evolved over time. In this context, production cost was recalculated for the last 4 years, on<br />
quarterly basis.<br />
The production cost historical series is presented in the figure below.<br />
<strong>Production</strong> Cost History (USD/metric ton)<br />
31
PROCESS ECONOMICS SUMMARY<br />
Heret<strong>of</strong>ore, the capital cost and production cost related to the process examined were described. This chapter<br />
provides a summary <strong>of</strong> all capital and production costs related to the process described so far. Also, in order to<br />
provide a more consistent economic analysis <strong>of</strong> the process examined, all such costs are combined in a single<br />
item: “Product Value”.<br />
“Product value” is a term commonly used wherein all costs associated with the manufacture <strong>of</strong> a product are<br />
combined. More specifically, it includes the production cost (manufacturing variable costs, manufacturing fixed<br />
costs, corporate overhead costs and depreciation), as well as an expected return on capital employed (ROCE).<br />
Product value should not be confused with product price. While product value, as previously mentioned, is<br />
calculated based on the costs associated with the manufacture <strong>of</strong> a product, product price is the actual value as<br />
seen in the market.<br />
The graph below illustrates the composition <strong>of</strong> the product value.<br />
The table on the next page condenses the analysis developed in this report.<br />
32
<strong>Economics</strong> <strong>of</strong> <strong>Propylene</strong> <strong>Production</strong> <strong>via</strong> <strong>Metathesis</strong> - Datasheet<br />
BASIS:<br />
PLANT CAPACITY & OPERATION<br />
Nominal capacity<br />
Operating rate<br />
Annual production<br />
CAPITAL INVESTMENT SUMMARY<br />
Fixed capital<br />
Working capital<br />
Additional capital<br />
TOTAL CAPITAL INVESTMENT<br />
MM USD<br />
DESCRIPTION<br />
QUANTITY PER MT PRICE USD/MT MM USD/YR<br />
%<br />
Gross raw materials cost<br />
By-product credits<br />
Net raw materials cost<br />
Net utilities cost<br />
MANUFACTURING VARIABLE COSTS<br />
Operating labor<br />
Supervision<br />
Maintenance cost<br />
Operating charges<br />
Plant overhead<br />
Prop. taxes and insur.<br />
oper./shift<br />
USD/oper./h<br />
sup./shift<br />
USD/sup./h<br />
<strong>of</strong> fixed capital<br />
<strong>of</strong> operating labor costs<br />
operating labor and maintenance costs<br />
<strong>of</strong> fixed capital<br />
MANUFACTURING FIXED COSTS<br />
OPERATING CASH COST<br />
Administration costs<br />
<strong>of</strong> operating labor and maintenance costs<br />
Marketing & distribution<br />
<strong>of</strong> operating cash costs at full capacity<br />
Research & development <strong>of</strong> operating cash costs at full capacity<br />
CORPORATE OVERHEAD<br />
Depreciation<br />
ROCE<br />
TOTAL PRODUCTION COST<br />
PRODUCT VALUE<br />
<strong>of</strong> total capital investment<br />
33
LABOR WAGE RATES & PRICING BASIS<br />
This chapter presents the labor wage rates, as well as raw materials and products prices used in the economic<br />
analysis for the current report.<br />
Labor Wage Rates (USD/hour)<br />
PERIOD OPERATOR SUPERVISOR<br />
34
Pricing Basis<br />
PERIOD<br />
35
REFERENCES<br />
36
37
ANALYSIS METHODOLOGY<br />
Introduction<br />
Intratec distilled its expertise, gained from more than a decade <strong>of</strong> supporting companies worldwide in the analysis<br />
<strong>of</strong> chemical markets and process economics, and developed a consistent report development methodology.<br />
The Intratec Industrial Process methodology ensures a holistic, coherent and consistent techno-economic<br />
evaluation, guiding the development <strong>of</strong> a report that allows readers to fully understand a specific chemical process<br />
technology.<br />
In addition to being based on a common methodology, all Intratec Industrial Process reports have a common<br />
structure, i.e., indexes, tables and charts share similar standards. This ensures that Intratec’s readers know<br />
upfront what they will get and, more than that, will be able to compare technologies addressed in different reports.<br />
Our methodology is continuously tested and proven by the many chemical and oil corporations, R&D centers, EPC<br />
companies, financial institutions and government agencies that rely on our reports.<br />
The methodology used in the development <strong>of</strong> Industrial Processes <strong>Economics</strong> reports is illustrated in the diagram<br />
presented on the next page.<br />
Bibliographical Research<br />
The report is based on a comprehensive bibliographical research, entirely focused on the industrial process to be<br />
examined. Our research encompasses patents, encyclopedias, text books, technical papers and non-confidential<br />
information disclosed by licensors, duly reviewed by the Intratec team.<br />
The main goal <strong>of</strong> this research is to provide a solid understanding <strong>of</strong> the process examined, which in fact underlies<br />
the entire study. During this research, Intratec team identifies the maturity <strong>of</strong> the process under analysis.<br />
Basically, established processes are mature industrial processes, i.e., several plants employing these processes<br />
have been constructed worldwide, while new industrial processes are those that have only been employed in a few<br />
plants constructed around the world. Finally, early-stage industrial processes are the processes still under<br />
development; currently, either no plants have employed such technologies or the designs <strong>of</strong> the processes<br />
themselves have yet to be completed.<br />
Process Overview<br />
The Intratec team’s first goal is to understand the chemical, biological and/or physical transformations occurring<br />
in the target process, as well as reactants required and products formation.<br />
Thus, initially, bibliographical research focuses on stoichiometry, conversions, yields and/or selectivity <strong>of</strong><br />
processes’ main reactions or biological processes, while also addressing the occurrence <strong>of</strong> side reactions and<br />
relevant information about catalyst employed.<br />
Regarding raw materials, the Intratec team identifies minimum quality requirements (e.g. minimum purity,<br />
maximum presence <strong>of</strong> specific contaminants), as well as typical industrial sources. For products, the Intratec<br />
team gathers information regarding possible uses and applications, as well as the usual specifications necessary<br />
to ensure their suitability for those applications.<br />
38
39
Examining an Industrial Site<br />
At this point, the Intratec team examines how an industrial site based on the process under analysis would be, in<br />
terms <strong>of</strong> production units and infrastructure required.<br />
<strong>Production</strong> Units<br />
The Intratec team compiles all knowledge acquired around the process into a process block flow diagram,<br />
showing major process areas and main process streams, accompanied by a process description. The process<br />
areas correspond to what Intratec defines as “functional units”. Basically, a “functional unit” is a significant step in<br />
the production process in which a particular physico-chemical operation (i.e., distillation, reaction, evaporation,<br />
etc.) occurs. According to this definition, a given functional unit is not associated with a single piece <strong>of</strong> equipment,<br />
but rather with a group <strong>of</strong> equipment and ancillaries required to perform a particular operation.<br />
Such division in process areas not only facilitates process understanding, but also serves as the basis for further<br />
economic analysis development.<br />
While outlining process block flow diagram, the Intratec team also maps key technical parameters related to each<br />
process area portrayed, including: highest operating temperature and pressure, representative material <strong>of</strong><br />
construction <strong>of</strong> equipment, and other parameters. These parameters serve as inputs for the cost estimating<br />
methods used by Intratec, further described in this methodology.<br />
Site Infrastructure<br />
The Intratec team also examines the industrial site in terms <strong>of</strong> the infrastructure (OSBL facilities) required. More<br />
specifically, this analysis identifies installations that are required but do not directly enter into the manufacture <strong>of</strong> a<br />
product (e.g., storage, utilities supply, auxiliary and administrative buildings).<br />
The first step in identifying the required infrastructure is to define the level <strong>of</strong> integration the industrial site under<br />
analysis will have with nearby facilities or industrial complexes. Integration levels primarily impact storage<br />
requirements – e.g., a plant that is not integrated needs storage for all raw materials and products, while a plant<br />
that is fully integrated with nearby complexes does not need such installations.<br />
The Intratec team assumes a level <strong>of</strong> integration based on what is most typical for the type <strong>of</strong> industrial plant<br />
examined. So, based on the process analysis previously developed and on how integrated the industrial site will<br />
be, the Intratec team defines the OSBL facilities requirements.<br />
Defining Site Requirements<br />
* Key Process Inputs & Outputs<br />
At this point, the main processing steps have been identified and global material balance calculations are<br />
performed. This preliminary global material balance leads to the identification <strong>of</strong> key process indicators, which<br />
reflect raw material consumption and products generation rates per amount <strong>of</strong> the main product manufactured.<br />
It is worth mentioning that estimation <strong>of</strong> raw material requirements in the conceptual design phase is generally<br />
reasonably accurate but tends to be somewhat understated compared to real operations. Losses from vessel<br />
vents, unscheduled equipment, inerting systems, physical property inaccuracies, startup, shutdown and other<br />
process operations not typically addressed in conceptual design may increase raw materials consumption.<br />
40
* Labor<br />
Operating labor is associated with the number <strong>of</strong> operators per shift actually required to run the equipment, while<br />
supervision labor is the personnel per shift required to directly supervise the operating labor.<br />
The number <strong>of</strong> operators and supervisors estimated is based on the type and number <strong>of</strong> functional units included<br />
in the process examined.<br />
Also, it is important to mention that in addition to the operating and supervision labor considered, chemical plants<br />
also require other types <strong>of</strong> labor, not included as an operating cost item. Examples <strong>of</strong> such labor are: maintenance<br />
labor, outsourced labor, technical assistance to manufacturing, plant engineers, restaurant, purchasing, employee<br />
relations department, etc.<br />
Capital Investment Estimating<br />
The costs that comprise the capital investment are grouped under three main headings: fixed capital; working<br />
capital; and additional capital requirements.<br />
Before estimating such capital investment figures, the Intratec team defines plant nominal capacity according to<br />
the process under analysis, considering that the plant should be competitive on a global scale.<br />
Once this assumption has been made, the Intratec team begins the actual estimation <strong>of</strong> the capital investment<br />
figures as follows.<br />
Fixed Capital<br />
The fixed capital is related to the erection <strong>of</strong> the industrial site itself. Also referred as “capital expenditures”<br />
(CAPEX), the fixed capital constitutes the fraction <strong>of</strong> the capital investment which is depreciable.<br />
It is composed <strong>of</strong> Inside Battery Limits (ISBL) Investment, Process Contingency, Outside Battery Limits (OSBL)<br />
Investment and Project Contingency, estimated as follows.<br />
* Inside Battery Limits (ISBL) Investment<br />
The ISBL investment is the fraction <strong>of</strong> the fixed capital associated with the construction <strong>of</strong> all process areas<br />
(functional units) portrayed in the process block flow diagram.<br />
Initially, to calculate ISBL investment, the Intratec team approaches each process area individually. The fixed<br />
capital <strong>of</strong> a given area is estimated based on the respective process parameters detailed in the block flow diagram<br />
(flow rates, pressure and temperature conditions, materials <strong>of</strong> construction, complexity), through the use <strong>of</strong><br />
specific preliminary cost models.<br />
It is worth noting that the Intratec cost models were founded on a number <strong>of</strong> established cost estimating methods,<br />
based on mathematical and statistical processing <strong>of</strong> an extensive volume <strong>of</strong> actual cost data <strong>of</strong> well-known<br />
industrial processes and functional units. In fact, such a massive refining <strong>of</strong> established methods has led to<br />
robust cost models, continuously tested and proven for more than a decade by major global companies that rely<br />
on Intratec’s cost estimates <strong>of</strong> industrial processes.<br />
So, from the process parameters identified, the output <strong>of</strong> Intratec cost models is the fixed capital for each<br />
functional unit, including all costs associated with the erection <strong>of</strong> those units: direct material and labor costs, as<br />
well as indirect costs, such as construction overheads, including: payroll burdens, field supervision, equipment<br />
41
entals, tools, field <strong>of</strong>fice expenses, temporary facilities, etc.<br />
In the case <strong>of</strong> nonstandard functional unit, additional research is conducted and the capital cost is estimated from<br />
the use <strong>of</strong> specialized engineering design s<strong>of</strong>tware or through quotations provided by equipment suppliers.<br />
Finally, the sum <strong>of</strong> all fixed capital figures, associated with the functional units examined, leads to the total ISBL<br />
investment figure.<br />
* Process Contingency<br />
Process contingency is utilized in an effort to lessen the impact <strong>of</strong> absent technical information or the uncertainty<br />
<strong>of</strong> that which is obtained. That being the case, the reliability <strong>of</strong> the information gathered, its amount and the<br />
inherent complexity <strong>of</strong> the process are significant to its evaluation. Errors that occur may be related to:<br />
(1) Addition and integration <strong>of</strong> new process steps<br />
(2) Uncertainty in process parameters, such as severity <strong>of</strong> operating conditions and quantity <strong>of</strong> recycles<br />
(3) Estimation <strong>of</strong> cost through scaling factors<br />
(4) Off-the-shelf equipment<br />
Hence, process contingency is a function <strong>of</strong> the maturity <strong>of</strong> the technology and the reliability <strong>of</strong> the information<br />
gathered for the analysis. This value typically falls between 5% and 20% <strong>of</strong> ISBL investment.<br />
* Outside Battery Limits (OSBL) Investment<br />
The OSBL investment is the fraction <strong>of</strong> the fixed capital associated with the construction <strong>of</strong> all infrastructure<br />
(storage, utilities, auxiliary units and buildings) required.<br />
The Intratec team employs cost estimation models similar to those previously described for estimating OSBL<br />
investment, i.e., initially, a preliminary design <strong>of</strong> OSBL equipment is defined based on the process requirements.<br />
This preliminary design information serves as an input to Intratec's cost estimation models.<br />
* Project Contingency<br />
Project Contingency is included to cover the costs which may arise as the project evolves, related to: project errors<br />
or incomplete specifications, labor costs changes, strikes, problems caused by weather; inflation, etc.<br />
Project contingency is largely dependent on the plant complexity and technology maturity, identified during initial<br />
research. The following table shows how project contingency varies according to such aspects.<br />
Project Contingency<br />
PROCESS MATURITY<br />
PLANT COMPLEXITY<br />
Simple<br />
Typical<br />
Complex<br />
Established Industrial Processes<br />
15%<br />
20%<br />
25%<br />
New Industrial Processes<br />
20%<br />
25%<br />
30%<br />
Early-Stage Industrial Processes<br />
25%<br />
30%<br />
40%<br />
42
* Fixed Capital Validation<br />
Depending on the availability <strong>of</strong> information about the process examined, the Intratec team utilizes three different<br />
methods to double-check fixed capital estimates:<br />
(1) Published investment data, related to the construction <strong>of</strong> industrial plants <strong>of</strong> that process worldwide (adjusted<br />
in time, location and production capacity); and/or<br />
(2) Fixed capital <strong>of</strong> similar plants (adjusted in time, location and production capacity); and/or<br />
(3) Reverse engineering methods, i.e., the fixed capital is calculated based on the known pr<strong>of</strong>itability <strong>of</strong> the process<br />
examined.<br />
Fixed Capital Breakdown<br />
The report also presents a fixed capital breakdown, detailing how the fixed is divided into direct process costs and<br />
indirect process costs.<br />
The direct process costs comprise the following costs:<br />
* Bare Equipment. This is the cost associated with the purchase <strong>of</strong> process equipment<br />
* Equipment Setting. Those are costs related to the labor cost for setting the purchased equipment in place.<br />
* Piping. The costs related to piping include materials, such as valves, fittings, pipe and supports used in the<br />
erection <strong>of</strong> the piping used directly in the process (for raw materials, intermediate-products, finished-products,<br />
steam, water, air, as well as any other process piping). The labor for piping erection and installation is also covered<br />
in this topic.<br />
* Civil. This topic covers costs associated with material and labor required for equipment foundations and civil<br />
work related to any building required in the industrial site.<br />
* Steel. Costs associated with material and labor required for equipment platforms erection, as well as any<br />
supports needed during equipment installation.<br />
* Instrumentation & Control. Those costs relate to instruments, controllers and industrial networks material, and<br />
labor required to install it.<br />
* Electrical. The costs related to electrical system cover power wiring, instrument wiring, lighting, as well as<br />
transformation and service.<br />
* Insulation. Costs related to any labor or material required to insulate process equipment, either for process<br />
needs or for operators safety.<br />
* Painting. Those costs are related to labor and material required to paint and/or coat equipment according to<br />
process requirements.<br />
The indirect process costs are described below:<br />
* Engineering & Procurement. Engineering expenses include process and project engineers involved in process<br />
and construction design, as well as associated overhead. Development <strong>of</strong> computer-based drawings and cost<br />
engineering are also costs included in this topic. Procurement costs are those related to the purchase team,<br />
43
associated home <strong>of</strong>fice and overhead, and accounting pr<strong>of</strong>essionals.<br />
* Construction Material & Indirects. Those costs relate to field temporary buildings and their operation,<br />
construction tools, rentals, home <strong>of</strong>fice personnel located at the construction site, construction payroll, burdens<br />
and benefits.<br />
* General & Administrative Overheads. General and administrative costs are associated with construction<br />
management and general costs incurred during construction, such as construction supervision, taxes and<br />
insurance, internal and licensed s<strong>of</strong>tware, communications and travel & living.<br />
* Contract Fee. Expenses related to contract fees for engineering, equipment purchase and construction work.<br />
Fixed Capital Estimate Accuracy<br />
The accuracy range for the fixed capital cost estimate obtained according to the methods hereby presented is<br />
-15% to -35% on the low side and +25% to +60% on the high side. This accuracy range is mainly influenced by:<br />
* Reliability and amount <strong>of</strong> the information available<br />
* Examined technology maturity<br />
* Degree <strong>of</strong> extension <strong>of</strong> the study<br />
As previously explained, the fixed capital is estimated based on the preliminary design <strong>of</strong> functional units which, in<br />
turn, relies on a process scheme. The greatest essential uncertainty lies in the basic conception <strong>of</strong> this process<br />
scheme. The level <strong>of</strong> uncertainty varies broadly among published information and from steps <strong>of</strong> a process in a<br />
given research. In some instances, sufficient information may not be available to support rigorous estimation,<br />
thus, only basic design methods are warranted.<br />
The maturity <strong>of</strong> the examined technology, in turn, also plays an important role in the fixed capital estimates. Earlystage<br />
processes require an extra level <strong>of</strong> caution.<br />
In addition, the extension <strong>of</strong> the analysis helps enormously to reduce uncertainties and improve the accuracy <strong>of</strong><br />
the cost estimation. Detailed studies are crucial to achieving more precise estimates.<br />
Finally, the non-uniform spread <strong>of</strong> accuracy ranges (+50 to – 30 %, rather than ±40%, e.g.) is justified by the fact<br />
that a lack <strong>of</strong> available information usually results in underestimating rather than overestimating project costs.<br />
Working Capital<br />
For the purposes <strong>of</strong> Industrial Process reports, working capital is defined as the funds, in addition to the fixed<br />
capital, that a company must contribute to a project. Those funds must be adequate to getting the plant into<br />
operation and meeting subsequent obligations.<br />
The initial amount <strong>of</strong> working capital is regarded as an investment item.<br />
items/assumptions for working capital estimation:<br />
The Intratec team uses the following<br />
* Accounts receivable. Products shipped to but not paid for by the customer; represents the extended credit<br />
given to customers (estimated as a certain period – in days – <strong>of</strong> production cost including depreciation).<br />
* Accounts payable. A credit for accounts payable such as feedstock, chemicals, and packaging materials<br />
received but not paid to suppliers (estimated as a certain period – in days – <strong>of</strong> cash cost plus corporate overhead).<br />
44
* Product inventory. Products in storage tanks. The total amount depends on sales flow for each plant, which is<br />
directly related to plant conditions <strong>of</strong> integration to the manufacturing <strong>of</strong> the product‘s derivatives (estimated as a<br />
certain period – in days – <strong>of</strong> production cost including depreciation).<br />
* Raw material inventory. Raw materials in storage tanks. The total amount depends on raw material availability,<br />
which is directly related to plant conditions <strong>of</strong> integration to raw material manufacturing (estimated as a certain<br />
period – in days – <strong>of</strong> raw material delivered costs).<br />
* In-process inventory. Material contained in pipelines and vessels, except for the material inside the storage<br />
tanks (assumed to be 1 day <strong>of</strong> cash cost plus corporate overhead).<br />
* Supplies and stores. Parts inventory and minor spare equipment (estimated as a percentage <strong>of</strong> operating labor<br />
and supervision and maintenance cost).<br />
* Cash on hand. An adequate amount <strong>of</strong> cash on hand to give plant management the necessary flexibility to<br />
cover unexpected expenses (estimated as a certain period – in days – <strong>of</strong> cash cost plus corporate overhead).<br />
Additional Capital Requirements<br />
There are certain one-time expenses related to bringing a process on stream. From a time standpoint, a variable<br />
undefined period exists between the nominal end <strong>of</strong> construction and the production <strong>of</strong> quality product in the<br />
quantity required. This period is commonly referred to as start-up.<br />
During the start-up period, expenses are incurred for operator and maintenance employee training, temporary<br />
construction, auxiliary services, testing and adjustment <strong>of</strong> equipment, piping, and instruments, etc. Intratec’s<br />
method <strong>of</strong> estimating start-up expenses may consist <strong>of</strong> the following components:<br />
* Labor training. Represents costs <strong>of</strong> plant crew training for plant start-up, estimated as a certain number <strong>of</strong> days<br />
<strong>of</strong> total plant labor costs (operators, supervisors, maintenance personnel and laboratory labor).<br />
* Commercialization costs. Commercialization costs are those associated with marketing the product and<br />
include developing a market plan, establishing a distribution network and devising a customer support strategy.<br />
Those costs are dependent on how integrated the plant is with consumer facilities and on the maturity <strong>of</strong> the<br />
product – how established and well-known it is. These costs range from 0.5% to 5% <strong>of</strong> annual cash cost plus<br />
corporate overhead.<br />
* Start-up inefficiency. Takes into account those operating runs when production cannot be maintained or there<br />
are false starts. Start-up inefficiency varies according to the process maturity: 5% for early-stage processes, 2%<br />
for new processes, and 1% for established processes, based on annual cash cost plus corporate overhead.<br />
* Unscheduled plant modifications. A key fault that can happen occur during the start-up <strong>of</strong> the plant is the risk<br />
that the product(s) may not meet specifications required by the market. As a result, equipment modifications or<br />
additions may be required.<br />
* Prepaid Royalties. Royalty charges on portions <strong>of</strong> the plant are usually levied for proprietary processes. A value<br />
ranging from 0.5 to 1% <strong>of</strong> the fixed capital is generally used.<br />
* Site Development. Site preparation, including roads and walkways, parking, railroad sidings, lighting, fencing,<br />
sanitary and storm sewers, and communications.<br />
45
<strong>Production</strong> Cost Estimating<br />
Pricing & Wage Rates Definition<br />
In order to calculate fixed and variable manufacturing costs, the Intratec team collects average transaction prices<br />
<strong>of</strong> raw materials and average operators’ wage rates in the region examined in the study.<br />
The prices are based on trade statistics issued by <strong>of</strong>ficial government agencies, over the time period considered.<br />
Pricing information is checked to verify consistency, but issues like differences in product qualities, discounts<br />
related to volumes, or contractual negotiations are not considered.<br />
However, for some chemicals, there are no trade statistics (e.g., intermediate chemicals that are not traded<br />
because <strong>of</strong> transportation issues, but are usually generated and consumed onsite). In those cases, the Intratec<br />
team assumes a transfer price that considers all the costs related to the manufacturing <strong>of</strong> that product plus an<br />
amount to pay the investment made to manufacture it.<br />
The operators’ wage rates are based on data published by <strong>of</strong>ficial government agencies.<br />
Manufacturing Variable Cost<br />
Variable costs change in direct proportion to changes in the production level. Examples <strong>of</strong> common variable costs<br />
include raw materials and utilities.<br />
The Intratec team calculates the manufacturing variable costs <strong>of</strong> the plant under analysis from previously<br />
identified process input and output figures and historical pricing data, as follows:<br />
Manufacturing Variable Costs = Net Raw Material Costs + Net Utilities Costs<br />
* Net Raw Materials Costs<br />
“Net raw material costs” are the difference between raw materials costs and credits from by-products generation,<br />
as expressed in the formula below.<br />
Net Raw Material Costs = Raw Material Costs – By-product Credits<br />
The raw materials costs, in turn, are estimated by multiplying process’ consumption figures by the respective raw<br />
material prices in the region considered. The formula below illustrates the raw materials costs calculation:<br />
Raw Material Costs = Sum ( Raw Material Price * Raw Material Consumption )<br />
By-products credits were estimated in a similar way, based on process’ input and output figures and pricing data.<br />
* Net Utilities Cost<br />
In Industrial Processes <strong>Economics</strong> reports, the utilities cost component encompasses costs related to a plant’s<br />
consumption <strong>of</strong> steam, electricity, fuel, and refrigeration. These utilities requirements, in turn, are estimated<br />
through correlations internally developed by the Intratec team that were refined from a well-established method<br />
reported in technical literature by Mardsen et al. related to chemical process industries. (See “References” chapter)<br />
Through the use <strong>of</strong> these correlations, utilities consumption figures can be quickly estimated with basic<br />
information, related to chemical properties <strong>of</strong> components involved in the process and parameters presented in<br />
the block flow diagram. Such parameters include: number <strong>of</strong> functional units; type <strong>of</strong> each functional unit<br />
according to its energy consumption (i.e., if it involves phase changes, endothermic or exothermic reactions,<br />
46
negligible use <strong>of</strong> energy, if it is a nonstandard functional unit, etc.); flow rates; heats <strong>of</strong> reactions involved in the<br />
process; molecular weight and approximate boiling points <strong>of</strong> the components.<br />
Manufacturing Fixed Cost<br />
Manufacturing fixed costs are all the costs related to the plant operation that are not proportional to the plant<br />
operating rate. They are estimated as the sum <strong>of</strong> the following items:<br />
* Operating labor. This item accounts for the total costs <strong>of</strong> plant operators actually required to run the equipment.<br />
This cost includes wages, burdens and benefits. The annual operator cost is obtained according to the formula:<br />
number <strong>of</strong> operators per shift x number <strong>of</strong> shifts per day x operator hourly wage rate x hours worked per week x<br />
weeks per year.<br />
* Supervision. Accounts for the costs <strong>of</strong> field supervision labor, including wages, burdens and benefits. The<br />
annual supervision cost is obtained according to the formula: number <strong>of</strong> supervisors per shift x number <strong>of</strong> shifts<br />
per day x supervisor hourly wage rate x hours worked per week x weeks per year.<br />
* Maintenance cost. This item accounts for the costs related both to the labor and material costs related to the<br />
maintenance <strong>of</strong> the plant. It is calculated as a percentage <strong>of</strong> the fixed capital, ranging between from 1 to 5% <strong>of</strong><br />
TFC per year. This figure is primarily based on the type <strong>of</strong> equipment employed and the maturity <strong>of</strong> the process.<br />
* Operating charges. This category includes operating supplies (i.e., consumable items such as charts, lubricants,<br />
test chemicals, etc.); packaging; laboratory supplies and laboratory labor. It is calculated as a percentage <strong>of</strong> the<br />
total labor cost (item operating labor + item supervision).<br />
* Plant overhead. This item comprises all other non-maintenance (labor and materials) and non-operating site<br />
labor costs for services associated with the manufacture <strong>of</strong> the product, including: outsourced labor; technical<br />
assistance to manufacturing; plant engineers; restaurant; recreation; purchasing; employee relations department;<br />
and janitorial. It is calculated as a percentage <strong>of</strong> the sum <strong>of</strong> total labor and maintenance costs.<br />
* Property taxes and insurance. This cost is associated with the local property taxes charged by governments on<br />
commercial land or buildings as well as the cost <strong>of</strong> insurance to cover third party liabilities and potential plant<br />
damages. It is calculated as a percentage <strong>of</strong> the fixed capital per year.<br />
Depreciation<br />
Depreciation refers to the decrease in value <strong>of</strong> industrial assets with the passage <strong>of</strong> time, primarily due to wear and<br />
tear. While not a true manufacturing cost, depreciation is considered to be a manufacturing expense for<br />
accounting purposes – it allows the recovery <strong>of</strong> the cost <strong>of</strong> an asset over a time period.<br />
In this report, depreciation is calculated based on the straight-line method, according to which the cost <strong>of</strong> an asset<br />
is uniformly distributed over its lifetime. The Intratec team assumes a depreciation <strong>of</strong> 10 % <strong>of</strong> the fixed capital per<br />
year.<br />
Corporate Overhead<br />
Corporate overhead represents costs incurred by a company’s head <strong>of</strong>fice not directly related to the<br />
manufacturing process and is estimated as the sum <strong>of</strong> the following items:<br />
* Administration costs. This item comprises the executive and administrative activities. It includes salaries and<br />
wages for administrators, accountants, secretaries, legal costs, communications, <strong>of</strong>fice maintenance and other<br />
47
costs associated with the company’s head <strong>of</strong>fice. It is calculated as a percentage <strong>of</strong> the sum <strong>of</strong> total labor and<br />
maintenance costs.<br />
* Marketing & distribution. This is related to the costs associated with the distribution and sales (sales personnel,<br />
advertising, technical sales service) <strong>of</strong> the products manufactured in the plant. This cost is calculated as a<br />
percentage <strong>of</strong> the operating cash costs, considering the plant operating at full capacity, which varies according to<br />
the process maturity and the level <strong>of</strong> integration with product consumers.<br />
* Research & development. This is associated with the research activities related to the process and products<br />
and includes salaries and wages for personnel and funds for machinery, equipment, materials and supplies related<br />
to the research and development activities. This cost is calculated as a percentage <strong>of</strong> the operating cash costs,<br />
considering the plant operating at full capacity and will vary according to the process maturity.<br />
Product Value Estimating<br />
Heret<strong>of</strong>ore, capital investment and production cost <strong>of</strong> the process examined were estimated. The next step in the<br />
methodology is the development <strong>of</strong> a more consistent analysis, encompassing all costs estimated so far.<br />
In this context, all costs estimated are combined in a single item: the “Product Value”. More specifically, the<br />
product value results from the sum <strong>of</strong> production costs (i.e., manufacturing variable costs, manufacturing fixed<br />
costs, corporate overhead and depreciation) with a return on capital employed (ROCE), a parcel which reflects the<br />
capital investment. The formula below expresses the product value calculation.<br />
Product Value = Manufacturing Variable Costs + Manufacturing Fixed Costs + Corporate Overhead + Depreciation +<br />
Expected ROCE Amount<br />
where all components are expressed in US dollars per amount <strong>of</strong> product.<br />
The expected ROCE amount is a component which reflects the capital costs <strong>of</strong> a given process into its product<br />
value. This component is based on the expected return on capital employed typically aimed by chemical<br />
companies. It is calculated by multiplying capital costs by the expected ROCE percentage, divided by the total<br />
amount <strong>of</strong> product manufactured:<br />
Expected ROCE Amount = Capital Costs * Expected ROCE Percentage / Product Annual <strong>Production</strong><br />
This “Expected ROCE Amount” component is, in fact, a measure <strong>of</strong> the cost <strong>of</strong> investment required to construct the<br />
plant, in terms <strong>of</strong> US dollars per amount <strong>of</strong> product.<br />
Most chemical companies aim to achieve a ROCE percentage ranging from 10% to 30% for the construction <strong>of</strong> a<br />
new plant. In this context, the Intratec team assumes an expected ROCE percentage <strong>of</strong> 10% for established<br />
industrial processes.<br />
In contrast, a 30% expected ROCE is assumed for emerging industrial processes, as such processes inherently<br />
involve a larger amount <strong>of</strong> risk and cost uncertainty. It should be noted that the risk taken into account here is<br />
limited to the technical risk associated with the process uncertainties. Other venture risks were not considered,<br />
such as business environment, product market changes, increased competition, raw materials and product prices<br />
variations, change in government policy, etc.<br />
Finally, it is also important to mention that product value must not be confused with product price. While the<br />
product value is calculated based on production cost and expected ROCE, the product price is the actual value<br />
48
practiced in market transactions.<br />
Estimates Limitation<br />
The cost estimates presented in Industrial Processes <strong>Economics</strong> reports refer to a process technology based on a<br />
standardized design practice, typical <strong>of</strong> major chemical companies. The specific design standards employed can<br />
have a significant impact on capital and production costs. In this context, cost estimates calculated by Intratec<br />
team naturally have limitations.<br />
In fact, the accuracy range for production cost estimated in the present study is -10% to -20% on the low side and<br />
+10% to +20% on the high side, depending on the maturity level <strong>of</strong> the process examined. The presented accuracy<br />
considers a confidence level <strong>of</strong> 90%, which is consistent with the type <strong>of</strong> conceptual evaluation that this study<br />
aims to provide.<br />
Also, it is to be noted that the basis for capital and production costs estimation is that the plant is considered to be<br />
built in a clear field with a typical large single-line capacity. In comparing the cost estimates presented with actual<br />
plant costs and/or contractor's estimate, the following must be considered:<br />
* Minor differences or details (many times, unnoticed) between similar processes can noticeably affect cost.<br />
* The omission <strong>of</strong> process areas in the design considered may invalidate comparisons with the estimated cost<br />
presented.<br />
* Industrial plants may be overdesigned for particular objectives and situations.<br />
* Rapid fluctuation <strong>of</strong> equipment or construction costs may invalidate cost estimate.<br />
* Market price fluctuations may invalidate production cost estimate.<br />
* Equipment vendors or engineering companies may provide goods or services below pr<strong>of</strong>it margins during<br />
economic downturns.<br />
* Specific locations may impose higher taxes and fees, which can impact costs considerably.<br />
Furthermore, no matter how much time and effort are devoted to accurately estimating costs, errors may occur<br />
due to the aforementioned factors, as well as cost and labor changes, construction problems, weather-related<br />
issues, strikes, or other unforeseen situations. This is partially considered in the project contingency. Finally, it<br />
must always be remembered that an estimated project cost is not an exact number, but is rather a projection <strong>of</strong><br />
the probable cost.<br />
49
ABOUT INTRATEC<br />
Our Business<br />
Intratec is an independent research and leading advisory firm, recognized for excellence in the evaluation <strong>of</strong><br />
chemical markets and the economics <strong>of</strong> industrial process. We are a mix <strong>of</strong> process engineers, market researchers<br />
and cost estimators with extensive industry experience.<br />
Since 2002, the reports and databases we provide have increased the early recognition <strong>of</strong> promising research and<br />
capital investment opportunities in the chemical, petrochemical, oil, plastic, renewable and allied sectors. Our<br />
products have been used by our clients in multiple ways, such as:<br />
* To understand chemical market size, dynamics and attractiveness<br />
* To understand the feasibility <strong>of</strong> competitors’ technologies and developments<br />
* To obtain estimates <strong>of</strong> ventures’ pr<strong>of</strong>itability, capital and operating costs<br />
* To assess the economic potential <strong>of</strong> R&D breakthroughs<br />
* To ascertain the economic aspects and risks <strong>of</strong> their competitors’ research<br />
* To screen and assess industrial investment options<br />
* To define consistent business cases for investments<br />
* To evaluate / select independent licensors<br />
Our Reports<br />
Intratec has an extensive portfolio <strong>of</strong> reports targeting chemical markets and process economics. With more than<br />
900 up-to-date reports for the chemical, petrochemical, oil, energy, plastic, renewables and allied sectors, the<br />
Intratec portfolio is constantly growing.<br />
Intratec <strong>of</strong>fers the following types <strong>of</strong> reports:<br />
* <strong>Production</strong> Pathways Reports: Reports presenting paths to producing chemical and preliminary economic<br />
comparisons <strong>of</strong> those paths. From these reports, you can learn the ways in which changes in feedstocks and<br />
location can affect chemical production economics.<br />
* Industrial Process Reports: Techno-economic evaluations <strong>of</strong> chemical production processes. Each report<br />
provides an up-to-date economic assessment, including required capital costs in several locations and operating<br />
costs.<br />
50
Find below the chemicals covered in Intratec reports.<br />
encouraged to visit www.intratec.us.<br />
For a more complete and updated list, the reader is<br />
3-Hydroxypropionic Acid<br />
Acetone<br />
Acetylene<br />
Acetyls<br />
Acrylic Acid and Derivatives<br />
Acrylic/Maleic Copolymer<br />
Acrylonitrile<br />
Adipic Acid<br />
Aldehydes<br />
Alkylbenzenes<br />
Amino Acids<br />
Ammonia<br />
Aniline<br />
Biodiesel<br />
Bisphenol A<br />
BTX<br />
Butadiene and C4's<br />
C6's<br />
Caprolactam<br />
Carbon Monoxide<br />
Chlorine and Derivatives<br />
Chloroprene<br />
Citric Acid<br />
Cosmetics<br />
Cumene<br />
Detergents<br />
Dicyclopentadiene<br />
Diesel<br />
Dimethyl Carbonate (DMC)<br />
Dimethyl Terephthalate<br />
Diols<br />
Diphenyl Carbonate<br />
Dyes & Pigments<br />
Electricity<br />
Epichlorohydrin<br />
Ethanol<br />
Ethylene<br />
Ethylene Oxide<br />
Fertilizers<br />
Fibers<br />
Fire Retardants<br />
Food Additives<br />
Furans and Derivatives<br />
Glycerol<br />
Glycols<br />
Hydrogen<br />
Hydrogen Cyanide<br />
Hydrogen Peroxide<br />
Industrial Gases<br />
Insecticides<br />
Isocyanates<br />
Isophthalic Acid<br />
Isoprene<br />
Lactic Acid<br />
Linear Alpha Olefins<br />
Methacrylic Acid and Derivatives<br />
Methanol<br />
MTBE<br />
Nitric Acid<br />
Nitro Aromatics<br />
Nylon<br />
Oxalic Acid<br />
Oxo Alcohols<br />
Pentaerythritol<br />
PET<br />
Pharmaceuticals<br />
Phenol<br />
Phosgene<br />
Phthalic Anhydride<br />
Polyacrylate<br />
Polyacrylonitrile<br />
Polyalphaolefins<br />
Polycarbonates<br />
Polyesters<br />
Polyethers<br />
Polyethylenes<br />
Polylactic Acid (PLA)<br />
Polypropylene<br />
Polyurethanes<br />
Propanol and Isopropanol<br />
<strong>Propylene</strong><br />
<strong>Propylene</strong> Oxide<br />
PVC<br />
Reformate<br />
Resins<br />
Silanes<br />
Silicones<br />
Siloxanes<br />
Sodium Hydroxide<br />
Speciality Polymers<br />
Styrenics<br />
Succinic Acid<br />
Sulfuric Acid<br />
Synhetic Rubbers<br />
Synthesis Gas<br />
Vitamins<br />
Terephthalic Acid<br />
Trimethylolpropane<br />
Urea<br />
Vinyls<br />
51
APPENDIX 1: FIXED CAPITAL REGIONAL COMPARISON<br />
Obviously, the fixed capital required to erect an industrial unit is highly impacted by local conditions. By way <strong>of</strong><br />
illustration, several country-specific factors can largely influence construction costs, such as local productivity,<br />
labor costs, local steel prices, equipment imports needs, freight, taxes and duties on imports, regional business<br />
environments, local availability <strong>of</strong> sparing equipment, and so on.<br />
In this context, this appendix shows how much the fixed capital <strong>of</strong> the plant examined would be in different<br />
locations. Considering the same industrial plant previously described, this analysis compares fixed capital across<br />
the following countries:<br />
- United States<br />
- Germany<br />
- China<br />
- Japan<br />
- Saudi Arabia<br />
- Brazil<br />
- Singapore<br />
As an example, the following figure compares the fixed capital in the aforementioned countries.<br />
Fixed Capital per Region (USD Million)<br />
Regional fixed capital figures presented were directly obtained from the fixed capital originally calculated (United<br />
States-based plant), according to Intratec’s chemical plant location factors. These factors are calculated based on<br />
high volumes <strong>of</strong> local data <strong>of</strong> different locations, relating to productivity, labor costs, steel and energy prices,<br />
equipment import needs, freight, taxes and duties on imported and domestic materials and regional business<br />
environment, among others.<br />
52
APPENDIX 2: INTRATEC CHEMICAL PLANT CONSTRUCTION INDEX<br />
The IC Index stands for Intratec Chemical Plant Construction Index, an indicator published monthly by Intratec to<br />
scale capital costs from one time period to another. By way <strong>of</strong> illustration, to update a plant construction cost<br />
from 2009 to 2015, is necessary to multiply the cost at 2009 by the ratio <strong>of</strong> 2015’s index over 2009’s index,<br />
according to the following equation:<br />
Cost at 2015 = Cost at 2009 * (IC Index at 2015) / (IC Index at 2009)<br />
This index reconciles price trends <strong>of</strong> fundamental components <strong>of</strong> chemical plant construction such as labor,<br />
material and energy, providing meaningful historical and forecast data for our readers and clients.<br />
Covering historical figures and near term forecasts <strong>of</strong> up to twelve months, the IC Index is already a recognized<br />
cost-escalation index, widely used by the chemical industry community. It is a handy tool for a series <strong>of</strong> purposes,<br />
like procurement budgeting, capital project estimation and feasibility assessments.<br />
Figure. Intratec Chemical Plant Construction Index<br />
Readers can access Intratec construction cost-escalation index for free, at www.intratec.us. It is the only index<br />
available in the market that presents forecast and historical data.<br />
53
www.intratec.us