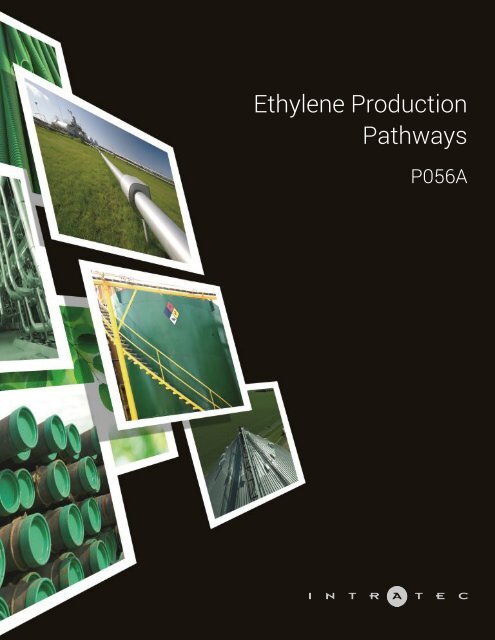
Ethylene Production Pathways
This report presents alternatives for producing PG Ethylene from different feedstocks, and compares their economic potential across different countries. Know more about this and other Ethylene reports at: www.intratec.us/products/ethylene-processes-comparison
This report presents alternatives for producing PG Ethylene from different feedstocks, and compares their economic potential across different countries. Know more about this and other Ethylene reports at: www.intratec.us/products/ethylene-processes-comparison

You also want an ePaper? Increase the reach of your titles
YUMPU automatically turns print PDFs into web optimized ePapers that Google loves.
<strong>Ethylene</strong> <strong>Production</strong><br />
<strong>Pathways</strong><br />
P056A
P056A<br />
<strong>Ethylene</strong> <strong>Production</strong> <strong>Pathways</strong><br />
<strong>Production</strong> <strong>Pathways</strong> Report<br />
ABSTRACT<br />
This report presents alternatives for producing PG <strong>Ethylene</strong> from different feedstocks, and compares their<br />
economic potential across different countries. More specifically, the report compares the costs of PG <strong>Ethylene</strong><br />
production through the following pathways:<br />
* Pathway 1: <strong>Ethylene</strong> <strong>Production</strong> from Ethane<br />
* Pathway 2: <strong>Ethylene</strong> <strong>Production</strong> from Ethane and Propane<br />
* Pathway 3: Green <strong>Ethylene</strong> <strong>Production</strong> from Ethanol<br />
In <strong>Pathways</strong> 1 and 2, <strong>Ethylene</strong> is produced via steam cracking of different feedstocks: ethane and a mixture of<br />
ethane and propane. In Pathway 3, <strong>Ethylene</strong> is produced from ethanol, which is a renewable feedstock.<br />
The analysis presented in this report includes:<br />
* A comparison of the economic potential of the pathways listed above in several countries, comprising:<br />
* Comparative analysis of capital costs<br />
* Comparative analysis of production costs<br />
* Historical behavior of the economic potential in the last 4 years<br />
* Comparison between product price and raw materials costs of each pathway<br />
* An overview of each production pathway, including:<br />
* Raw material(s) consumption figures and product(s) generated<br />
* Related technology licensors and block flow diagram of representative industrial processes<br />
Keywords: Hydrocarbon Pyrolysis, Cracking Furnace, Ethene, Propene, Shale Gas, CB&I Lummus, Technip, Shaw<br />
Stone & Webster, Kellogg-Braun & Root, KBR, Linde, Green <strong>Ethylene</strong>, Braskem, Chematur Technologies, Petron<br />
Scientech, Scientific Design, Dow Chemical, BP, Ethanol Dehydration
TERMS OF USE<br />
Data, information, tools, analyses and/or models herein presented are prepared on the basis of publicly available<br />
information and non-confidential information disclosed by third parties. Third parties, including, but not limited to<br />
technology licensors, trade associations or marketplace participants, may have provided some of the information<br />
on which the analyses or data are based.<br />
The data, information, tools, analyses and/or models herein presented are developed independently by Intratec<br />
and, as such, are the opinion of Intratec and do not represent the point of view of any third parties nor imply in any<br />
way that they have been approved or otherwise authorized by third parties that are mentioned in this report.<br />
Intratec conducts analyses and prepares reports and tools for readers in conformance with generally accepted<br />
professional standards. Although the statements in this report are derived from or based on several sources that<br />
Intratec believe to be reliable, Intratec does not guarantee their accuracy, reliability, or quality; any such<br />
information, or resulting analyses, may be incomplete, inaccurate or condensed. All estimates included in this<br />
report are subject to change without notice. This report is for informational purposes only and is not intended as<br />
any recommendation of investment.<br />
Reader agrees it will not, without prior written consent of Intratec, represent, directly or indirectly, that its products<br />
have been approved or endorsed by the other parties. In no event shall Intratec, its employees, representatives,<br />
resellers or distributors be liable to readers or any other person or entity for any direct, indirect, special, exemplary,<br />
punitive, or consequential damages, including lost profits, based on breach of warranty, contract, negligence, strict<br />
liability or otherwise, arising from the use of this report, whether or not they or it had any knowledge, actual or<br />
constructive, that such damages might be incurred.<br />
Reader agrees that Intratec retains all rights, title and interest, including copyright and other proprietary rights, in<br />
this report and all material, including but not limited to text, images, and other digital files, provided or made<br />
available as part of this report. The reader further agrees to refrain from any general release of the information<br />
presented in this report, so as to constitute passage of title into the public domain or otherwise jeopardize<br />
common law or statutory copyright.
TABLE OF CONTENTS<br />
ABOUT THIS REPORT......................................................................................................................................................................5<br />
Study Objective............................................................................................................................................................................ 5<br />
Report Overview...........................................................................................................................................................................6<br />
<strong>Production</strong> <strong>Pathways</strong>: Understanding the Concept.............................................................................................................7<br />
How to Understand the Analysis Presented in this Report................................................................................................ 9<br />
ABOUT ETHYLENE.........................................................................................................................................................................10<br />
Description................................................................................................................................................................................. 10<br />
Applications................................................................................................................................................................................10<br />
PG <strong>Ethylene</strong> <strong>Production</strong> <strong>Pathways</strong> Diagram.......................................................................................................................11<br />
Other <strong>Ethylene</strong> <strong>Production</strong> <strong>Pathways</strong> Reports................................................................................................................... 12<br />
PRODUCTION PATHWAYS EXAMINED.....................................................................................................................................13<br />
Pathway 1: <strong>Ethylene</strong> <strong>Production</strong> from Ethane.................................................................................................................... 14<br />
Pathway 2: <strong>Ethylene</strong> <strong>Production</strong> from Ethane and Propane............................................................................................19<br />
Pathway 3: Green <strong>Ethylene</strong> <strong>Production</strong> from Ethanol....................................................................................................... 24<br />
PATHWAYS COMPARATIVE EVALUATIONS............................................................................................................................29<br />
Introduction................................................................................................................................................................................29<br />
Comparison of <strong>Pathways</strong>........................................................................................................................................................30<br />
Regional Comparison...............................................................................................................................................................35<br />
PATHWAYS' COMPARISON SUMMARY................................................................................................................................... 40<br />
REPORT BASES & ASSUMPTIONS.............................................................................................................................................41<br />
<strong>Pathways</strong> Inputs and Outputs Figures................................................................................................................................. 41<br />
Market Prices............................................................................................................................................................................. 43<br />
REFERENCES..................................................................................................................................................................................47<br />
ANALYSIS METHODOLOGY......................................................................................................................................................... 48<br />
Initial Research.......................................................................................................................................................................... 48<br />
<strong>Pathways</strong> Overview.................................................................................................................................................................. 48<br />
Definition of Input and Output Figures................................................................................................................................. 48<br />
Pricing Data Gathering and Verification...............................................................................................................................50
Net Raw Materials Costs Estimating....................................................................................................................................50<br />
Capital Costs Estimating.........................................................................................................................................................50<br />
Other <strong>Production</strong> Costs Estimating...................................................................................................................................... 53<br />
Depreciation............................................................................................................................................................................... 54<br />
Economic Potential Estimating..............................................................................................................................................54<br />
Regional Comparisons.............................................................................................................................................................55<br />
ABOUT INTRATEC..........................................................................................................................................................................56<br />
Our Business.............................................................................................................................................................................. 56<br />
Our Reports................................................................................................................................................................................ 56
ABOUT THIS REPORT<br />
When considering the production of a chemical, there are complex and interconnected issues which must be<br />
thoroughly evaluated. Those who are interested in the production of a given chemical product must understand<br />
the options available and the key aspects that impact the economics of such options.<br />
There are several issues that affect the manufacturing economics of a chemical, such as feedstock used, other<br />
products generated, construction location, manufacturing integration, process technology selected, logistics, local<br />
government incentives and investment financing conditions, among others. Typically, the choice of feedstock<br />
used, other products generated and location are key to the feasibility of a chemical venture; as such, those<br />
variables should be the first to be addressed.<br />
This report is one of Intratec’s <strong>Production</strong> <strong>Pathways</strong> Reports. These reports show how the feedstock used, other<br />
products generated (if applicable) and construction location impact on the economics of chemicals production.<br />
Specifically, this report is designed to support those with an interest in understanding the economics of <strong>Ethylene</strong><br />
manufacturing, including:<br />
* Newcomers to the <strong>Ethylene</strong> sector,<br />
* Skilled technical professionals needing to gain a business perspective on <strong>Ethylene</strong> production, and<br />
* Professionals from the financial sectors, capital groups, consulting firms, legal, and research institutions, who<br />
need a quick understanding of the <strong>Ethylene</strong> business.<br />
While this report does not consider the other aforementioned aspects impacting chemical production (i.e., specific<br />
process technologies, logistics, government incentives), it must be viewed as a first step to rapidly learning about<br />
and comparing <strong>Ethylene</strong> production pathways and to serve as guide to further analyses.<br />
Study Objective<br />
This report presents the production paths of <strong>Ethylene</strong>, and preliminary economic comparisons between them, in<br />
different countries. After initially describing each production pathway to be examined, the report illustrates how<br />
options related to feedstock / other products mix and construction location affect the economics of <strong>Ethylene</strong><br />
production.<br />
The main purpose of the present report is to provide a rational and systematic approach with which one can<br />
discriminate between the economic potential of several production alternatives.<br />
Nevertheless, caution must be used when reading the results of the evaluations hereby presented. They are<br />
approximations, and intended to serve as "pointers" to production pathways that appear to be more competitive<br />
across different countries, in terms of production costs and the order of magnitude of capital costs.<br />
5
Report Overview<br />
This report is structured into six main parts that follow a logical sequence, each of which is briefly described<br />
below.<br />
By way of introduction, the first part – the current chapter – explains the report, its structure and objective, and<br />
introduces some basic concepts adopted in the study. To make the most of the study, the reader is encouraged to<br />
dedicate a couple of minutes to this chapter.<br />
In the second part, About <strong>Ethylene</strong>, the reader will learn the basics of <strong>Ethylene</strong> itself. This chapter covers<br />
applications, commercialization forms and production pathways available related to <strong>Ethylene</strong>.<br />
The third part, <strong>Production</strong> <strong>Pathways</strong> Examined, focuses exclusively on the production pathways which will be further<br />
evaluated in the report. This chapter provides brief descriptions of the pathways examined and some of their basic<br />
technical aspects, such as raw material(s), other product(s) generated and related industrial processes.<br />
The fourth part, encompassing <strong>Pathways</strong>’ Comparative Evaluations and <strong>Pathways</strong>’ Comparative Summary, is the core<br />
of the report. In these chapters, through a sequence of comparative analyses, reader will get a clear idea of how<br />
competitive the production pathways examined can be, compared against each other, across different countries.<br />
Readers needing to consult data used throughout the report, such as pricing and raw materials consumption<br />
figures, can find that information in the fifth part: Report Bases & Assumptions.<br />
Finally, to address any concerns about the methodology and procedures adopted throughout the development of<br />
this report, the reader is referred to the Analysis Methodology chapter.<br />
6
<strong>Production</strong> <strong>Pathways</strong>: Understanding the Concept<br />
The current report is structured on the concept of “production pathways” to compare the economics of different<br />
alternatives for manufacturing a chemical.<br />
A production pathway is a general representation of similar industrial processes that generate the same set of<br />
products from the same raw materials. Thus, within the concept of production pathways, this report combines<br />
industrial processes that will present similar results in a preliminary economic analysis.<br />
The figure below presents the production of a chemical of interest through 4 different pathways.<br />
This general representation encompasses industrial processes that present distinct technical aspects (e.g., unit<br />
operation sequence, catalysts, conversion rate and operating conditions). However, those differences are not<br />
relevant to a preliminary economic analysis such as the analysis presented in this study.<br />
7
The figure below illustrates how industrial processes are generalized under the concept of industrial pathways:<br />
In the example illustrated in the figure above, Pathway A is defined by the consumption of the Raw Material A, the<br />
generation of the Product X, and the production of the chemical product of interest. Pathway A can be achieved<br />
through 3 different options: Process M, Process N and Process O. In contrast, Pathway B is defined by the<br />
consumption of the Raw Materials A and B, by the generation of the Products X and Y, and the production of the<br />
chemical product of interest. In this case, Pathway B can be carried out in two different ways: the integration of<br />
the processes J and K, or by the process L. The definitions of <strong>Pathways</strong> C and D follow the same rationale.<br />
8
How to Understand the Analysis Presented in this Report<br />
Based on the definition of “production pathway” just given, it is important at this point to explain the nature of the<br />
economic evaluations made throughout this report.<br />
First, readers must bear in mind that all evaluations are made for “production pathways”, not for specific “industrial<br />
processes”. This means that all figures presented, such as raw material consumption or cost values, are<br />
representative of the respective production pathway examined.<br />
These analyses of production pathways make sense because the economics of pathway-related process<br />
technologies are typically in the same order of magnitude. Readers must be aware that the accuracy of pathways’<br />
cost figures estimated derives from the methodology used to calculate them. Of course, as mentioned previously,<br />
the cost figures of processes related to the same pathway fall within this accuracy range. The graph below<br />
illustrates that the cost figures of concurring processes vary, but remain within the range associated with the<br />
respective pathway.<br />
Also, in light of this explanation of the estimates’ accuracy range, if a given production pathway presents costs<br />
that are slightly higher than those of another pathway, it should not be deemed less competitive than the second<br />
pathway a priori. Instead of precisely identifying which may be the most competitive pathway, this report aims to<br />
identify pathways that are clearly less competitive, serving as a guide to further studies.<br />
Once again, caution must be used when reading the results of evaluations hereby presented. The main purpose of<br />
this report is to compare production economics, but within the accuracy associated with an analysis on a<br />
“production pathway” level.<br />
9
ABOUT ETHYLENE<br />
Description<br />
<strong>Ethylene</strong> is an unsaturated organic compound with the chemical formula C2H4. It has one double bond and is the<br />
simplest member of the alkene class of hydrocarbons.<br />
<strong>Ethylene</strong> is one of the largest volume petrochemicals worldwide. It is known as a key building block, serving as<br />
raw material in the manufacturing of several chemicals and end products such as plastics, resins, fibers, etc.<br />
Commercially, <strong>Ethylene</strong> is mainly traded as polymer grade (PG), i.e., min. 99.9% of purity. At room temperature, it is<br />
a colorless, low-boiling, flammable gas with a sweet odor.<br />
Applications<br />
Commercial <strong>Ethylene</strong> major application in the chemical industry is as a raw material for the production of<br />
polyethylene and other organic chemicals that are mainly utilized in consumable end uses, especially in packaging.<br />
Polyethylene (PE) is responsible for about 60% of the global <strong>Ethylene</strong> demand. The main class of polyethylene<br />
produced in the world is high density polyethylene (HDPE), which is responsible for the consumption of a third of<br />
the available <strong>Ethylene</strong>, followed by low density (LDPE) and linear low density (LLDPE) varieties.<br />
Other important products derived from <strong>Ethylene</strong> are ethylene oxide, an intermediate to ethylene glycol synthesis,<br />
ethylene dichloride, styrene, and vinyl acetate.<br />
With such a diverse range of derivative products, <strong>Ethylene</strong> demand is very sensitive to economic cycles. Therefore,<br />
it is often used as a reference in the performance evaluation of the petrochemical industry.<br />
10
PG <strong>Ethylene</strong> <strong>Production</strong> <strong>Pathways</strong> Diagram<br />
PG <strong>Ethylene</strong> is primarily produced by the pyrolysis of hydrocarbons and by recovery from some refinery products.<br />
It can also be produced from other pathways, such as ethanol dehydration or methanol-to-olefins plants. The<br />
following chart presents different pathways for PG <strong>Ethylene</strong> production.<br />
11
Other <strong>Ethylene</strong> <strong>Production</strong> <strong>Pathways</strong> Reports<br />
Below, the reader can find other reports offered by Intratec that introduce alternatives for producing propylene and<br />
compare the economic potential of such alternatives in different locations. For further details, please refer to the<br />
links below the report descriptions.<br />
<strong>Ethylene</strong> <strong>Production</strong> <strong>Pathways</strong> - P056B<br />
More specifically, this report compares the following production pathways<br />
* Pathway 1: <strong>Ethylene</strong> <strong>Production</strong> from Ethane<br />
* Pathway 2: <strong>Ethylene</strong> <strong>Production</strong> from Light Naphtha<br />
* Pathway 3: <strong>Ethylene</strong> <strong>Production</strong> from N-Butane<br />
In <strong>Pathways</strong> 1 and 2, <strong>Ethylene</strong> is produced via steam cracking of different feedstocks: ethane, naphtha and<br />
butane. These pathways also generate by-products such as hydrogen-rich gas, propylene and fuel.<br />
www.intratec.us/products/p056b<br />
<strong>Ethylene</strong> <strong>Production</strong> <strong>Pathways</strong> - P056C<br />
More specifically, this report compares the following production pathways<br />
* Pathway 1: <strong>Ethylene</strong> <strong>Production</strong> from Ethane<br />
* Pathway 2: <strong>Ethylene</strong> <strong>Production</strong> from Propane<br />
* Pathway 3: <strong>Ethylene</strong> <strong>Production</strong> from Atmospheric Gas Oil (AGO)<br />
In all pathways, <strong>Ethylene</strong> is produced via steam cracking of different feedstocks.<br />
www.intratec.us/products/p056c<br />
12
PRODUCTION PATHWAYS EXAMINED<br />
This chapter introduces the production pathways examined in this report. The pathways are listed below followed<br />
by an ID, in parentheses, which will be used in the charts and tables comparing these alternatives:<br />
* Pathway 1: <strong>Ethylene</strong> <strong>Production</strong> from Ethane (C2)<br />
* Pathway 2: <strong>Ethylene</strong> <strong>Production</strong> from Ethane and Propane (C2C3)<br />
* Pathway 3: Green <strong>Ethylene</strong> <strong>Production</strong> from Ethanol (ETOH)<br />
In <strong>Pathways</strong> 1 and 2, <strong>Ethylene</strong> is produced via steam cracking of different feedstocks: ethane and a mixture of<br />
ethane and propane. In Pathway 3, <strong>Ethylene</strong> is produced from ethanol, which is a renewable feedstock.<br />
Next, key technical information, such as a brief description, raw material(s) consumed, other product(s) generated<br />
and related industrial processes, will be presented for each one of the pathways listed above.<br />
13
Pathway 1: <strong>Ethylene</strong> <strong>Production</strong> from Ethane<br />
Description<br />
In this pathway, ethane is thermally cracked in the pyrolysis furnaces with the central goal of producing <strong>Ethylene</strong><br />
as the major product. The product mixture from cracking is then sent through a complex sequence of separation<br />
steps to obtain <strong>Ethylene</strong> and other desired products.<br />
Raw Material(s) Required<br />
The main raw material used in this pathway is ethane, which is detailed as follows.<br />
* Ethane<br />
Ethane is a colorless, odorless gas with the chemical formula C2H6.<br />
The main commercial sources of ethane are wet natural gases and refinery waste gases. Ethane is the secondlargest<br />
component of natural gas, only after methane. In natural gas from shale (or shale gas), the ethane content<br />
can reach up to 16% by volume. On industrial scale, it is separated from methane by liquefaction at cryogenic<br />
temperatures.<br />
The main use of ethane is as petrochemical feedstock for <strong>Ethylene</strong> manufacturing. In some cases, ethane is not<br />
separated from natural gas and it is burnt along with methane as fuel.<br />
Product(s) Generated<br />
The main product of this pathway is PG <strong>Ethylene</strong>. In addition, a hydrogen-rich gas and fuel are also generated, as<br />
described below.<br />
* Hydrogen-Rich Gas<br />
The cracking reaction also generates a hydrogen rich stream. In this pathway, this stream contains about 95 mol<br />
% of hydrogen and can be used as fuel.<br />
* Fuel<br />
In this pathway, other hydrocarbons are also generated in the cracking reaction such as: propylene, butadiene, etc.<br />
As only low amounts of such components are obtained, additional separation steps are not economically viable, in<br />
such a way that heavy ends, light ends and C3+ hydrocarbons streams generated are used as fuel.<br />
14
Pathway Scheme<br />
The following diagram shows the main steps utilized in this pathway, as well as the main raw materials consumed<br />
and the products and by-products generated.<br />
15
Industrial Processes Related to This Pathway<br />
16
* Industrial Process Diagram Example<br />
17
* Related Intratec Reports<br />
As mentioned previously, analyses provided in the current report are made on a “production pathway” level. For<br />
more detailed and accurate information about industrial processes related to Pathway 1: <strong>Ethylene</strong> <strong>Production</strong> from<br />
Ethane, the reader is referred to Industrial Process Economics Reports offered by Intratec, as listed below.<br />
Economics of <strong>Ethylene</strong> via Steam Cracking of Ethane | <strong>Ethylene</strong> E11A<br />
Economics of a steam cracking process for Polymer Grade (PG) <strong>Ethylene</strong> production from ethane in the USA.<br />
www.intratec.us/products/e056110a0<br />
Each of the above reports provide a techno-economic evaluation of a specific process technology, including capital<br />
costs in several locations, operating costs, raw materials consumptions, and detailed block flow diagrams.<br />
18
Pathway 2: <strong>Ethylene</strong> <strong>Production</strong> from Ethane and Propane<br />
Description<br />
In this pathway, a mixture of propane and ethane is thermally cracked in the pyrolysis furnaces with the central<br />
goal of producing <strong>Ethylene</strong> as the major product. The product mixture from cracking is then sent through a<br />
complex sequence of separation steps to obtain <strong>Ethylene</strong> and other desired products.<br />
Raw Material(s) Required<br />
The main raw material used in this pathway is a mixture of ethane and propane, which is detailed as follows.<br />
* Ethane/Propane Mix<br />
Ethane/Propane Mixture (or E/P Mix) is a blend of ethane (C2H6) and propane (C3H8). It is a colorless, odorless,<br />
flammable gas. It is mainly used as feedstock in steam cracking processes for ethylene production.<br />
The composition of this mixture typically varies between 70% and 90% of ethane and between 10% and 30% of<br />
propane. In this report, the composition considered is 80% ethane and 20% propane.<br />
Ethane, propane and butanes are also collectively referred to as natural gas liquids (NGL). Such components are<br />
recovered from “wet natural gas”. In the USA, NGLs market has substantially grown with the exploration of shale<br />
gas.<br />
Product(s) Generated<br />
The main product of this pathway is PG <strong>Ethylene</strong>.<br />
propylene, hydrogen-rich gas, and fuel.<br />
In addition, the following products are also generated: PG<br />
* PG Propylene<br />
Propylene is an unsaturated organic compound with the chemical formula C3H6. It is the second simplest<br />
member of the alkene class of hydrocarbons, only after ethylene. In this pathway, polymer grade (PG) propylene is<br />
obtained, i.e., propylene with min. 99.5% of purity.<br />
PG propylene is mainly used in polypropylene production. In addition, is also used as raw material in the<br />
manufacture of propylene oxide, oxo-alcohols, acrylonitrile, etc.<br />
* Hydrogen-Rich Gas<br />
The cracking reaction also generates a hydrogen rich stream. In this pathway, this stream contains about 95 mol<br />
% of hydrogen and can be used as fuel.<br />
* Fuel<br />
In this pathway, other hydrocarbons are also generated in the cracking reaction such as: butenes, butadiene, etc.<br />
As only low amounts of such components are obtained, additional separation steps are not economically viable, in<br />
such a way that heavy ends, light ends and C4+ hydrocarbons streams generated are used as fuel.<br />
19
Pathway Scheme<br />
The following diagram shows the main steps utilized in this pathway, as well as the main raw materials consumed<br />
and the products and by-products generated.<br />
20
Industrial Processes Related to This Pathway<br />
21
* Industrial Process Diagram Example<br />
22
* Related Intratec Reports<br />
As mentioned previously, analyses provided in the current report are made on a “production pathway” level. For<br />
more detailed and accurate information about industrial processes related to Pathway 2: <strong>Ethylene</strong> <strong>Production</strong> from<br />
Ethane and Propane, the reader is referred to Industrial Process Economics Reports offered by Intratec, as listed<br />
below.<br />
Economics of <strong>Ethylene</strong> via Cracking of Ethane/Propane | <strong>Ethylene</strong> E21A<br />
The process examined in this report uses a mixture of ethane and propane as raw material.<br />
analysis considers a plant located in the USA.<br />
The economic<br />
www.intratec.us/products/e056210a0<br />
Each of the above reports provide a techno-economic evaluation of a specific process technology, including capital<br />
costs in several locations, operating costs, raw materials consumptions, and detailed block flow diagrams.<br />
23
Pathway 3: Green <strong>Ethylene</strong> <strong>Production</strong> from Ethanol<br />
Description<br />
In this pathway, ethanol is dehydrated to ethylene. Since ethanol is produced from renewable sources, this<br />
pathway is an interesting alternative to the conventional production of ethylene from fossil-based feedstocks.<br />
Raw Material(s) Required<br />
The main raw material used in this pathway is hydrous ethanol, which is detailed as follows.<br />
* Hydrous Ethanol<br />
Ethanol, CH3CH2OH, also known as ethyl alcohol, performs several functions.<br />
germicide, a fuel, and as a chemical intermediate for other organic chemicals.<br />
It may work as a solvent, a<br />
In the present pathway, hydrous ethanol is used as feedstock, i.e., ethanol containing about 7% of water.<br />
Currently, ethanol is mostly produced via fermentation of sugars, which can be obtained from crops, such as<br />
sugarcane and corn starch. Researches have also been focused on the use of low-value biomass, often deemed<br />
“waste”, to produce ethanol. That low-value biomass is lignocellulosic material found in wood, sugarcane bagasse<br />
or grain crop stubbles. Lignocellulosic biomass could represent a new fermentable raw material. However,<br />
technological advances in this arena still need to be achieved in order to make it economically feasible and render<br />
this usage of the agricultural residues competitive with respect to others.<br />
Product(s) Generated<br />
PG <strong>Ethylene</strong> is the only product generated in the current pathway.<br />
24
Pathway Scheme<br />
The following diagram shows the main steps utilized in this pathway, as well as the main raw materials consumed<br />
and the products and by-products generated.<br />
Chemistry<br />
In this pathway ethanol is dehydrated to produce ethylene and water (see the reaction below). The dehydration<br />
reaction is an endothermic reversible reaction, with the equilibrium being favored by high temperatures and low<br />
pressures.<br />
25
Industrial Processes Related to This Pathway<br />
26
* Industrial Process Diagram Example<br />
27
* Related Intratec Reports<br />
As mentioned previously, analyses provided in the current report are made on a “production pathway” level. For<br />
more detailed and accurate information about industrial processes related to Pathway 3: Green <strong>Ethylene</strong><br />
<strong>Production</strong> from Ethanol, the reader is referred to Industrial Process Economics Reports offered by Intratec, as<br />
listed below.<br />
Economics of <strong>Ethylene</strong> via Ethanol Dehydration | <strong>Ethylene</strong> E81A<br />
Techno-economic analysis of PG <strong>Ethylene</strong> production from hydrous ethanol in the USA using a dehydration<br />
process similar to the one proposed by BP Chemicals.<br />
www.intratec.us/products/e056810a0<br />
Economics of <strong>Ethylene</strong> via Ethanol Dehydration | <strong>Ethylene</strong> E82A<br />
Economics of Polymer Grade (PG) <strong>Ethylene</strong> production from hydrous ethanol in the USA. Different from the report<br />
“<strong>Ethylene</strong> E81A”, the dehydration process examined in this report is similar to the processes developed by<br />
Chematur and Petron.<br />
www.intratec.us/products/e056820a0<br />
Economics of <strong>Ethylene</strong> via Ethanol Dehydration | <strong>Ethylene</strong> E83A<br />
This study also presents the costs associated with Green <strong>Ethylene</strong> production from ethanol in the USA. Different<br />
from the report “<strong>Ethylene</strong> E82A”, this study depicts a process similar to the processes developed by Braskem and<br />
Petrobras. In this process, the reaction system is composed of multiple reactors and multiple furnaces.<br />
www.intratec.us/products/e056830a0<br />
Economics of <strong>Ethylene</strong> via Ethanol Dehydration | <strong>Ethylene</strong> E84A<br />
Different from the other reports about ethylene production via ethanol dehydration, the process analyzed in this<br />
study is similar to the process developed by Scientific Design. In this process, the reaction system is composed by<br />
only one reactor and one furnace. The study also assumes a plant constructed in the USA.<br />
www.intratec.us/products/e056840a0<br />
Economics of <strong>Ethylene</strong> via Ethanol Dehydration | <strong>Ethylene</strong> E85A<br />
This study also concerns Green <strong>Ethylene</strong> production in the USA. Different from the other reports, the technology<br />
examined in this report is similar to the one developed by Dow Chemical. In this process, a selective oxidation<br />
reactor is used in the purification step to remove CO and hydrogen from the process.<br />
www.intratec.us/products/e056850a0<br />
Each of the above reports provide a techno-economic evaluation of a specific process technology, including capital<br />
costs in several locations, operating costs, raw materials consumptions, and detailed block flow diagrams.<br />
28
PATHWAYS COMPARATIVE EVALUATIONS<br />
Introduction<br />
Throughout this chapter, a number of economic comparative evaluations between the production pathways<br />
described are made, encompassing raw materials costs, utilities costs, fixed costs, capital costs and pathway<br />
economic potential. Such evaluations consider typical representative industrial units based on each pathway<br />
under analysis and utilize the following main assumptions:<br />
* All industrial plants present the same annual production<br />
* Economic analysis date is<br />
More information on assumptions adopted can be found in the chapter “Report Bases & Assumptions”.<br />
In order to provide a solid understanding of the economic potential of all pathways, the comparative evaluations<br />
are made from two perspectives, as explained below.<br />
1) Comparison of <strong>Pathways</strong>. The goal here is to compare the economic aspects of the different production<br />
pathways examined in the United States. In other words, the reader will be able to evaluate the competitiveness of<br />
all pathways under analysis, using the USA as a basis for comparison (see figure below).<br />
2) Regional Comparisons. This analysis compares the economic aspects of a given pathway across different<br />
countries. For each pathway examined, the reader will learn which country tends to be more competitive (see<br />
following figure).<br />
29
Caution must be used when examining the results of these comparisons presented hereafter. They are<br />
approximations, and intended to serve as "pointers" to the production pathways which appear to be the most<br />
competitive across different world regions.<br />
Comparison of <strong>Pathways</strong><br />
This section compares the economic aspects of the production pathways examined, assuming all industrial plants<br />
are constructed in the USA.<br />
Net Raw Materials Cost<br />
In the following graph, each bar represents the net raw materials costs related to a specific pathway in the USA, in<br />
US dollars per metric ton of PG <strong>Ethylene</strong>. “Net raw material costs” is the difference between raw materials costs<br />
and credits from by-products generation, if available, in each pathway examined.<br />
Net Raw Material Costs Comparison @ USA (USD / metric ton product)<br />
This graph itself is a first indicator of the economic potential of each pathway. The pathway representing the<br />
greatest difference between PG <strong>Ethylene</strong> price and net raw materials costs has the highest margin to bear further<br />
production costs (i.e., utilities costs, other production costs, capital costs). Ultimately, the lower the bar, the higher<br />
the potential of a pathway to be economically attractive.<br />
In contrast, pathways with net raw materials costs higher than the PG <strong>Ethylene</strong> prices can be considered<br />
economically unfeasible at this time. It is important to highlight, however, that a pathway considered to be<br />
economically unfeasible is related to the period in which this analysis was made. Evolving pricing conditions may<br />
of course lead to different conclusions.<br />
30
Capital Costs<br />
The following graph illustrates, comparatively, pathways-related capital costs, i.e., each bar represents the capital<br />
costs related to a specific pathway for an industrial unit constructed in the USA. As presented in the graph, the<br />
capital costs bar comprises two items: Total Process Capital and Contingency.<br />
For the sake of comparison, the capital costs for all pathways were normalized, meaning that the capital costs of<br />
each pathway were divided by the capital costs related to Pathway 1: <strong>Ethylene</strong> <strong>Production</strong> from Ethane.<br />
Capital Costs Comparison @ USA<br />
The total process capital estimates encompass the investment required for the construction of the main<br />
processing units necessary to the manufacture of product(s), as well as auxiliary facilities typically needed for the<br />
functioning of such production units (i.e., storage, utilities supply, and auxiliary buildings).<br />
In addition, as presented in the graph, a contingency for each capital cost estimate was considered. Contingency<br />
constitutes an addition to capital cost estimations, implemented based on previously available data or experience<br />
to encompass uncertainties that may incur, to some degree, cost increases. Higher contingencies were assumed<br />
for new, emerging production pathways, based on the risks associated with the uncertainties involved in such<br />
pathways.<br />
The capital costs estimates presented do not include working capital and additional capital costs associated with<br />
plants’ start-up. The presented estimates were obtained using methods designed for the rapid calculation of<br />
capital costs for the construction of process industries. For information on how capital costs were estimated, the<br />
reader is referred to the Capital Costs Estimating section in the chapter titled “Analysis Methodology”.<br />
31
Economic Potential<br />
In this section, the economic potentials of each pathway examined are compared when considering industrial<br />
plants constructed within the USA.<br />
The economic potential of a pathway is directly related to the “product value” associated with that pathway.<br />
“Product value” is a term commonly used wherein all costs associated with the production of a product are<br />
combined. More specifically, it includes the production cost (net raw materials, net utilities, fixed costs, corporate<br />
overhead costs and depreciation), as well as an expected return on capital employed (ROCE).<br />
It should be noted that the product value must not be confused with product price. While the product value, as<br />
previously mentioned, is calculated based on the costs associated with the production of a product, the product<br />
price is the actual value as seen in the market.<br />
In the following graph, each bar represents the product value of a specific pathway normalized by division by the<br />
Pathway 1: <strong>Ethylene</strong> <strong>Production</strong> from Ethane product value.<br />
Product Value Comparison @ USA<br />
This graph, in fact, combines all comparisons done so far. In the end, pathways with the lowest product values<br />
stand out as the best candidates for further studies.<br />
The following table complements the graph presented, providing the cost figures that make up pathways’ product<br />
values. Once again, the product values presented were normalized utilizing Pathway 1: <strong>Ethylene</strong> <strong>Production</strong> from<br />
Ethane as the basis.<br />
32
Product Value Comparison @ USA<br />
The raw materials costs and capital costs presented were already discussed in previous chapters.<br />
components making up the product value are briefly described below.<br />
Other cost<br />
* Utilities costs: costs associated with main process utilities required in each pathway (steam, electricity, fuel, and<br />
refrigeration).<br />
* Other production costs: includes the fixed costs (e.g. maintenance, operating labor, operating charges, plant<br />
overhead) and corporate overhead costs (i.e., company’s costs associated with R&D, administrative activities,<br />
marketing and products distribution).<br />
* Depreciation: refers to the decrease in value of industrial assets over the passage of time, primarily because of<br />
wear and tear.<br />
* ROCE: a component of product value which reflects the capital costs of a given pathway, based on an expected<br />
return on capital employed in the construction of the plants.<br />
For information on how product values were calculated, the reader is referred to Economic Potential Estimating<br />
section in the chapter titled “Analysis Methodology.”<br />
The comparisons presented so far are frozen snapshots, based exclusively on<br />
it should be kept in mind that different pricing conditions could lead to different results.<br />
economic data. Of course,<br />
In order to provide a more consistent approach to pathways’ competitiveness, this analysis also compares how<br />
pathways’ economic potentials have evolved over time in the USA. In this context, the following graph presents<br />
the product values variation over the last quarters.<br />
33
Quaterly Comparative Product Values History @ USA<br />
Complementing this analysis, a 4-year economic potential history based on the USA is presented below. The<br />
figures presented are yearly averages for the product values available up to the period of the analysis. Here, the<br />
values presented are also comparative - they were normalized using Pathway 1: <strong>Ethylene</strong> <strong>Production</strong> from Ethane<br />
product value at the current period of analysis as the basis.<br />
Yearly Comparative Product Values History @ USA<br />
34
Regional Comparison<br />
This section examines each pathway individually, comparing its economic aspects across the following countries:<br />
* United States<br />
* Germany<br />
* China<br />
* Brazil<br />
* South Africa<br />
Basically, this presents economic aspects previously discussed, specifically, net raw material costs and product<br />
values, under a regional perspective.<br />
Net Raw Materials Costs<br />
The next graphs present the net raw materials cost and PG <strong>Ethylene</strong> price in US dollars per ton of PG <strong>Ethylene</strong> for<br />
each of the pathways in different countries.<br />
Pathway C2: Net Raw Material Costs Vs. Product Price (USD / metric ton product)<br />
35
Pathway C2C3: Net Raw Material Costs Vs. Product Price (USD / metric ton product)<br />
Pathway ETOH: Net Raw Material Costs Vs. Product Price (USD / metric ton product)<br />
36
Net raw materials costs were calculated using the same methods as the previous section, considering, however,<br />
local pricing data related to the country examined (presented in the chapter titled “Report Bases & Assumptions”).<br />
Historical Economic Potential Comparison<br />
In order to regionally compare the economic potential of each pathway, all items that comprise the product value<br />
(namely, net raw materials costs, utilities costs, other production costs, depreciation and return on capital<br />
employed) were properly adjusted for each country examined.<br />
Similar to the analysis provided for the USA in the previous section (Comparison of <strong>Pathways</strong>), this section also<br />
compares how pathways’ product values have evolved over time in several world locations.<br />
The following graphs present a 4-year history of the economic potential for each production pathway in several<br />
countries. The figures presented are yearly averages for the product values available up until the period of the<br />
analysis ( ). Here, the values presented are also comparative - they were normalized considering Pathway<br />
1: <strong>Ethylene</strong> <strong>Production</strong> from Ethane product value in the period of the analysis, in the USA as the basis.<br />
37
Pathway C2: Yearly Comparative Product Values History<br />
Pathway C2C3: Yearly Comparative Product Values History<br />
38
Pathway ETOH: Yearly Comparative Product Values History<br />
39
PATHWAYS' COMPARISON SUMMARY<br />
The following graph is an overall summary presenting the economic potential of each production pathway in<br />
several countries.<br />
Each bar represents the product value associated with a specific pathway in a specific country in . The<br />
values are normalized based on the product value related to Pathway 1: <strong>Ethylene</strong> <strong>Production</strong> from Ethane, in the<br />
United States.<br />
Product Values Comparison Summary<br />
40
REPORT BASES & ASSUMPTIONS<br />
<strong>Pathways</strong> Inputs and Outputs Figures<br />
This section presents raw materials consumption figures and products generated rates, if applicable, for each<br />
production pathway examined. The tables below summarize major input and output figures adopted.<br />
It is important to mention that the figures hereby presented are not related to any specific industrial process.<br />
Rather, they are averages that represent each pathway sufficiently to support the comparative evaluations<br />
presented in this report within the accuracy expected.<br />
For information on how processes inputs and outputs were defined, the reader is referred to the Definition of Input<br />
and Output Figures section in the chapter titled “Analysis Methodology.”<br />
Pathway C2: Input & Output Figures (unit per MMBtu of product)<br />
DESCRIPTION UNIT<br />
STOICHIOMETRY VALUE ADOPTED VALUE<br />
Raw Materials<br />
By-Products<br />
Pathway C2C3: Input & Output Figures (unit per metric ton of product)<br />
DESCRIPTION UNIT<br />
STOICHIOMETRY VALUE ADOPTED VALUE<br />
Raw Materials<br />
By-Products<br />
41
Pathway ETOH: Input & Output Figures (unit per metric ton of product)<br />
DESCRIPTION UNIT<br />
STOICHIOMETRY VALUE ADOPTED VALUE<br />
Raw Materials<br />
42
Market Prices<br />
This section presents raw materials and products market prices used in the economic analysis for the current<br />
report. Each table presents a 4-year history for a certain product in the countries studied in this report.<br />
43
44
45
46
REFERENCES<br />
47
ANALYSIS METHODOLOGY<br />
After more than a decade supporting leading companies worldwide, Intratec has gained considerable expertise in<br />
the analysis of chemical markets and process economics. All of this expertise is distilled in our reports through<br />
the use of consistent development methodologies.<br />
Our methodologies ensure that our reports are reliable, structured, and continuously tested and proven by the<br />
many corporations, R&D centers, EPC companies, financial institutions and government agencies that rely on<br />
those reports.<br />
The methodology used in the development of <strong>Production</strong> <strong>Pathways</strong> Reports is illustrated in the diagram presented<br />
on the next page.<br />
Initial Research<br />
The development of a <strong>Production</strong> <strong>Pathways</strong> report starts with research focused on existing alternatives<br />
(pathways) for manufacturing a given chemical, related to different raw materials and/or products generated. This<br />
encompasses patents, encyclopedias, text books, technical papers and non-confidential information disclosed by<br />
licensors, duly reviewed by the Intratec team.<br />
Following completion of this initial research, Intratec assembles a diagram, illustrating major production pathways<br />
that have been identified.<br />
<strong>Pathways</strong> Overview<br />
Subsequently, the Intratec team conducts additional bibliographical research and data gathering focused on each<br />
individual production pathway, with the goal of identifying the key aspects of the pathways under analysis,<br />
including:<br />
* Overall manufacturing scheme,<br />
* Raw material(s) required and product(s) generated,<br />
* Related industrial processes and technology licensors, and<br />
* Annual production adopted and utilization rates assumed (based on competitive plants on a global market)<br />
Regarding raw materials, and product(s) generated, in particular, the Intratec team evaluates their basic<br />
specifications (grade, purity, water content, etc.) and if product(s) are sold at market price or at the fuel equivalent<br />
price.<br />
Definition of Input and Output Figures<br />
In a next step, raw materials consumption and products generation figures associated with each production<br />
pathway examined are estimated. Initially, the stoichiometry of main reactions involved in the process is identified<br />
after which additional research is carried out focusing on identifying conversions, yields and/or selectivity of<br />
processes’ main reactions in order to find the ranges of key input and output figures. This research encompasses<br />
process information currently available in patents, encyclopedias, text books, technical papers and non-<br />
48
confidential information disclosed by licensors.<br />
Finally, the input and output figures adopted in the analysis are defined by utilising:<br />
* Best judgment based on the conversions, yields and/or selectivity ranges identified on processes reactions,<br />
* Values directly disclosed in the literature (when available), and<br />
* Analogies with similar processes and/or reactions data available in Intratec’s database.<br />
49
Pricing Data Gathering and Verification<br />
In order to compare the economic aspects of the pathways, the Intratec team uses average transaction prices of<br />
products and raw materials across different regions. These prices are based on trade statistics issued by the<br />
official government agencies of the countries examined, over the time period considered. The pricing information<br />
is checked to verify consistency, but issues such as discounts related to volumes or contractual negotiations are<br />
not considered.<br />
In some cases, e.g., when market prices do not exist for some chemicals or raw materials, the Intratec team<br />
assumes transfer prices, based on estimates of costs to produce that chemical.<br />
In addition, when by-products are utilized for energy generation, their prices are calculated based on fuel prices<br />
and their respective heat of combustion.<br />
Net Raw Materials Costs Estimating<br />
From previously identified raw materials consumptions and historical pricing data, the Intratec team calculates the<br />
net raw materials costs of each pathway. “Net raw material costs” is the difference between raw materials costs<br />
and credits from by-products generation, as expressed in the formula below.<br />
Net Raw Material Costs = Raw Material Costs – By-product Credits<br />
The raw materials costs, in turn, are estimated by multiplying pathways’ consumption figures by the respective<br />
raw material prices in the region considered. The formula below illustrates the raw materials costs calculation:<br />
Raw Material Costs = Sum ( Raw Material Price * Raw Material Consumption )<br />
By-products credits were estimated in a similar way, based on pathways’ input and output figures and pricing data.<br />
Capital Costs Estimating<br />
The first step in estimating capital costs is determining the definition of a comparison basis for the production<br />
pathways under analysis. Initially, based on previous research, the Intratec team defines a common annual<br />
production target for the industrial units that represent each pathway.<br />
The actual nominal capacity of each representative process plant is then established according to typical<br />
utilization rates addressing specific raw materials availability constraints. For instance, plants based on renewable<br />
raw materials (e.g., sugar cane) present lower utilization rates than plants relying on oil derivatives, since some<br />
renewables raw materials are only available during harvest season, while oil is available throughout the entire year.<br />
Another issue in the comparison basis definition concerns the maximum feasible nominal capacity of industrial<br />
units based on different pathways. Due to technical limitations, industrial units based on some pathways are not<br />
able to achieve the same maximum production capacity as plants based on another compared pathway. In those<br />
cases, instead of thinking in terms of an unfeasible plant scale for the former pathway, the Intratec team considers<br />
multiple industrial units side-by-side (multiple production trains), thus establishing a fair comparison basis for all<br />
pathways.<br />
The Intratec team then begins elaborating the capital costs estimates associated with each pathway. The capital<br />
cost is essentially composed of two items: Total Process Capital and Contingency. Both items’ definitions and<br />
50
estimating methods are more fully described in the next sections.<br />
The following figure summarizes the capital costs estimating methodology.<br />
Total Process Capital Estimating<br />
The total process capital is comprised of the investment required for the construction of main processing units<br />
necessary to the manufacture of product(s), as well as auxiliary facilities typically necessary to the functioning of<br />
such production unit(s) (i.e., storage, utilities supply, and auxiliary buildings).<br />
The Intratec team employs three different methods for estimating total process capital, according to the nature of<br />
the pathway under analysis.<br />
* <strong>Pathways</strong> Based on Established Industrial Processes<br />
This type of pathway is based on mature industrial processes, i.e., several plants worldwide have been constructed<br />
over the years, employing processes related to such a pathway.<br />
For these pathways, total process capital is primarily estimated from the Intratec database. More specifically, the<br />
51
Intratec team initially gathers investment data in the company’s database (such data were actually generated in<br />
previous studies, specifically targeting the industrial processes under analysis). The total process capital data<br />
collected are then adjusted to the same basis – converted in time, location and production capacity. Finally, the<br />
Intratec team double-checks total process capital estimates that have been obtained; this is based on published<br />
investment data, related to the construction of industrial plants of that pathway worldwide.<br />
* <strong>Pathways</strong> Based on New Industrial Processes<br />
<strong>Pathways</strong> are based on new industrial processes when there have only been a few plants constructed around the<br />
world.<br />
Total process capital associated with this kind of pathway is calculated according to internal cost estimating<br />
methods, refined from established techniques designed for rapid calculations of total process capital for the<br />
construction of process industries. These established techniques include significant step methods such as Zevnik<br />
and Buchanan, Wilson, Timm, and Petley correlations (see “References” chapter).<br />
Generally speaking, Intratec methods consist of making rapid total process capital calculations from preliminary<br />
block diagrams with main process steps and basic process parameters, such as the physical state of fluid being<br />
processed, capacity or throughput of processing steps, approximate information about operating conditions<br />
(pressure and temperature) and probable materials of construction. Using these inputs, which are primarily<br />
derived from the technical literature, the Intratec team calculates the initial total process capital figures.<br />
Subsequently, total process capital estimates obtained are double-checked based on data available in Intratec’s<br />
database that are related to the total process capital of similar plants (after correcting for time, location and scale).<br />
In some cases, when the profitability associated with the pathway examined is known, the Intratec team may also<br />
double-check estimates using reverse engineering methods. In other words, using this method, the total process<br />
capital amount would be calculated based on the known profitability of the pathway examined.<br />
* <strong>Pathways</strong> Based on Embryonic Industrial Processes<br />
These pathways employ industrial processes which are still under development; in fact, no published data related<br />
to investments or even a well-defined process exists.<br />
In such cases, Intratec total process capital estimates are based on previously explained estimating methods<br />
designed for rapid total process capital calculations and analogies with similar industrial plants and/or processing<br />
units.<br />
Similar to what is done for pathways based on new industrial processes, the Intratec team begins by drawing<br />
preliminary flowsheet sketches and compiling basic process parameters from technical literature (e.g. patents,<br />
articles) available. Based on such inputs, the Intratec team develops initial estimates of the amount of total<br />
process capital required for the construction of hypothetical industrial plants. Estimates obtained are then<br />
compared to the known total process capital figures (corrected in time, location and capacity) of similar industrial<br />
plants and/or processing units.<br />
Contingency<br />
In addition, a contingency is considered for each total process capital estimate. Contingency constitutes an<br />
addition to total process capital estimations, implemented based on previously available data or experience to<br />
encompass uncertainties that may incur, to some degree, capital cost increases. More specifically, these<br />
52
uncertainties may be related to:<br />
* Technical information: uncertainty in equipment and performance, accurate definition of process parameters (i.<br />
e., severity of operating conditions, quantity of recycles) and allowance for design changes, and<br />
* Problems that must be overcome during construction or plant start-up: project errors or incomplete<br />
specifications, labor costs changes, strikes, problems caused by weather; inflation of costs.<br />
Higher contingencies are assumed for emerging production pathways, according to the risks associated with the<br />
uncertainties involved in such pathways. In this context, a contingency of 20% is assumed for established<br />
pathways; a contingency of 30% is assumed for new processes, with few operating plants; and, for embryonic<br />
processes still under development, a contingency of 45% is adopted.<br />
Estimates Scope Limitations<br />
It is important to mention that the capital costs estimates presented do not include working capital and additional<br />
capital costs associated with plants’ start-up. Working capital is defined as the funds, in addition to the total<br />
investment, that a company must contribute to a project to get the plant into operation and to meet subsequent<br />
obligations. Further, additional start-up capital costs are associated with the money spent during the period<br />
between the nominal end of construction and the production of quality product in the quantity required (e.g.,<br />
operator and maintenance employee training, testing and adjustment of equipment, etc.).<br />
Accuracy<br />
The accuracy range for capital cost estimates obtained according to the methods hereby presented is -25% to<br />
-40% on the low side and +35% to +80% on the high side, depending on the maturity level of the pathway<br />
examined. The presented accuracy considers a confidence level of 90%, which is consistent with the type of<br />
conceptual evaluations that this study aims to do.<br />
Other <strong>Production</strong> Costs Estimating<br />
At this point, net raw materials costs and capital costs of all pathways have already been calculated. There are,<br />
however, other relevant production costs not yet included, namely, fixed costs, corporate overhead costs, net<br />
utilities costs and depreciation.<br />
In this study, the utilities costs component encompasses costs related to a plant’s energy requirements, mainly<br />
including: steam, electricity, and fuel. These energy requirements are estimated based on the heat of reactions<br />
involved in a given pathway. The correlation used by the Intratec team was refined from a well-established<br />
method reported in technical literature by Lange, related to chemical process industries. (See “References”<br />
chapter)<br />
Fixed costs include costs of maintenance, operating labor, operating charges and plant overhead. Such costs do<br />
not change when production volume in a plant changes.<br />
Corporate overhead is associated with costs incurred by company’s head office such as general administrative<br />
costs, research and development activities related to the process and product, market and product distribution.<br />
Finally, it is worth noting that costs associated with catalyst and minor chemicals consumed in the process are<br />
not considered in the analysis performed in the present report.<br />
53
Depreciation<br />
Depreciation refers to the decrease in value of industrial assets with the passage of time, primarily due to wear and<br />
tear. While not a true manufacturing cost, depreciation is considered to be a manufacturing expense for<br />
accounting purposes – it allows the recovery of the cost of an asset over a time period.<br />
In this report, depreciation is calculated based on the straight-line method, according to which the cost of an asset<br />
is uniformly distributed over its lifetime. The Intratec team assumes a depreciation of 10 % of the capital costs per<br />
year.<br />
Economic Potential Estimating<br />
Heretofore, the pathways examined were compared separately in terms of raw materials and capital costs. The<br />
next step in the methodology is the comparison between the economic potential of each pathway examined. Such<br />
economic potential, in turn, is measured through the combination of all costs estimated for a given pathway in a<br />
single item: the “Product Value”.<br />
More specifically, the product value results from the sum of production costs (i.e., net raw material costs, net<br />
utilities costs, other production costs and depreciation) with the return on capital employed (ROCE). The formula<br />
below expresses the product value calculation.<br />
Product Value = Net Raw Material Costs + Net Utilities Cost + Other <strong>Production</strong> Costs + Depreciation + Expected ROCE<br />
Amount<br />
where all components are expressed in US dollars per amount of product.<br />
The expected ROCE amount is a component which reflects the capital costs of a given pathway into its product<br />
value. This component is based on the expected return on capital employed typically aimed by chemical<br />
companies. It is calculated by multiplying capital costs by the expected ROCE percentage, divided by the total<br />
amount of product manufactured:<br />
Expected ROCE Amount = Capital Costs * Expected ROCE Percentage / Product Annual <strong>Production</strong><br />
This “Expected ROCE Amount” component is, in fact, a measure of the cost of investment required to construct the<br />
plant, in terms of US dollars per amount of product.<br />
Most chemical companies aim to achieve a ROCE percentage ranging from 10% to 30% for the construction of a<br />
new plant. In this context, the Intratec team assumes an expected ROCE percentage of 10% for established<br />
industrial processes.<br />
In contrast, a 30% expected ROCE is assumed for emerging industrial processes, as such processes inherently<br />
involve a larger amount of risk and cost uncertainty. It should be noted that the risk taken into account here is<br />
limited to the technical risk associated with the process uncertainties. Other venture risks were not considered,<br />
such as business environment, product market changes, increased competition, raw materials and product prices<br />
variations, change in government policy, etc.<br />
Finally, it is also important to mention that the product value must not be confused with product price. While the<br />
product value is calculated based on production costs and expected ROCE, the product price is the actual value<br />
practiced in market transactions.<br />
54
The accuracy range for product values estimated in the present study is -15% to -20% on the low side and +15% to<br />
+25% on the high side, depending on the maturity level of the pathway examined. The presented accuracy<br />
considers a confidence level of 90%, which is consistent with the type of conceptual evaluation that this study<br />
aims to provide.<br />
Regional Comparisons<br />
Thus far, all analyses developed were based on a specific region. The last step of report development is the<br />
evaluation of each pathway individually, comparing net raw material costs and economic potential, across<br />
different countries. Next, the way in which such costs are calculated for each of the countries examined will be<br />
presented.<br />
Net raw materials costs are calculated using the same methods previously described, considering, however, local<br />
pricing data related to the countries examined<br />
Capital costs and depreciation estimates are directly converted to other locations according to Intratec’s chemical<br />
plant location factors. These factors are calculated based on high volumes of local data of different locations,<br />
relating to productivity, labor costs, steel and energy prices, equipment import needs, freight, taxes and duties on<br />
imported and domestic materials and regional business environment, among others.<br />
The utilities costs initially calculated are, in turn, adjusted for each country based on local market fuel price data.<br />
Finally, fixed costs and corporate overhead costs are calculated mainly based on local labor costs and the capital<br />
costs associated with each location examined.<br />
55
ABOUT INTRATEC<br />
Our Business<br />
Intratec is an independent research and leading advisory firm, recognized for excellence in the evaluation of<br />
chemical markets and the economics of industrial process. We are a mix of consulting professionals, market<br />
researchers and cost estimators with extensive industry experience.<br />
Since 2002, the reports and databases we provide have increased the early recognition of promising research and<br />
capital investment opportunities in the chemical, petrochemical, oil, plastic, renewable and allied sectors. Our<br />
products have been used by our clients in multiple ways, such as:<br />
* To understand chemical market size, dynamics and attractiveness<br />
* To understand the feasibility of competitors’ technologies and developments<br />
* To obtain estimates of ventures’ profitability, capital and operating costs<br />
* To assess the economic potential of R&D breakthroughs<br />
* To ascertain the economic aspects and risks of their competitors’ research<br />
* To screen and assess industrial investment options<br />
* To define consistent business cases for investments<br />
* To evaluate / select independent licensors<br />
Our Reports<br />
Intratec has an extensive portfolio of reports targeting chemical markets and process economics. With more than<br />
900 up-to-date reports for the chemical, petrochemical, oil, energy, plastic, renewables and allied sectors, the<br />
Intratec portfolio is constantly growing.<br />
Intratec offers the following types of reports:<br />
* <strong>Production</strong> <strong>Pathways</strong> Reports: Reports presenting paths to producing chemical and preliminary economic<br />
comparisons of those paths. From these reports, you can learn the ways in which changes in feedstocks and<br />
location can affect chemical production economics.<br />
* Industrial Process Reports: Techno-economic evaluations of chemical production processes. Each report<br />
provides an up-to-date economic assessment, including required capital costs in several locations and operating<br />
costs.<br />
56
Find below the chemicals covered in Intratec reports.<br />
encouraged to visit www.intratec.us<br />
For a more complete and updated list, the reader is<br />
3-Hydroxypropionic Acid<br />
Acetone<br />
Acetylene<br />
Acetyls<br />
Acrylic Acid and Derivatives<br />
Acrylic/Maleic Copolymer<br />
Acrylonitrile<br />
Adipic Acid<br />
Aldehydes<br />
Alkylbenzenes<br />
Amino Acids<br />
Ammonia<br />
Aniline<br />
Biodiesel<br />
Bisphenol A<br />
BTX<br />
Butadiene and C4's<br />
C6's<br />
Caprolactam<br />
Carbon Monoxide<br />
Chlorine and Derivatives<br />
Chloroprene<br />
Citric Acid<br />
Cosmetics<br />
Cumene<br />
Detergents<br />
Dicyclopentadiene<br />
Diesel<br />
Dimethyl Carbonate (DMC)<br />
Dimethyl Terephthalate<br />
Diols<br />
Diphenyl Carbonate<br />
Dyes & Pigments<br />
Electricity<br />
Epichlorohydrin<br />
Ethanol<br />
<strong>Ethylene</strong><br />
<strong>Ethylene</strong> Oxide<br />
Fertilizers<br />
Fibers<br />
Fire Retardants<br />
Food Additives<br />
Furans and Derivatives<br />
Glycerol<br />
Glycols<br />
Hydrogen<br />
Hydrogen Cyanide<br />
Hydrogen Peroxide<br />
Industrial Gases<br />
Insecticides<br />
Isocyanates<br />
Isophthalic Acid<br />
Isoprene<br />
Lactic Acid<br />
Linear Alpha Olefins<br />
Methacrylic Acid and Derivatives<br />
Methanol<br />
MTBE<br />
Nitric Acid<br />
Nitro Aromatics<br />
Nylon<br />
Oxalic Acid<br />
Oxo Alcohols<br />
Pentaerythritol<br />
PET<br />
Pharmaceuticals<br />
Phenol<br />
Phosgene<br />
Phthalic Anhydride<br />
Polyacrylate<br />
Polyacrylonitrile<br />
Polyalphaolefins<br />
Polycarbonates<br />
Polyesters<br />
Polyethers<br />
Polyethylenes<br />
Polylactic Acid (PLA)<br />
Polypropylene<br />
Polyurethanes<br />
Propanol and Isopropanol<br />
Propylene<br />
Propylene Oxide<br />
PVC<br />
Reformate<br />
Resins<br />
Silanes<br />
Silicones<br />
Siloxanes<br />
Sodium Hydroxide<br />
Speciality Polymers<br />
Styrenics<br />
Succinic Acid<br />
Sulfuric Acid<br />
Synhetic Rubbers<br />
Synthesis Gas<br />
Vitamins<br />
Terephthalic Acid<br />
Trimethylolpropane<br />
Urea<br />
Vinyls<br />
57
www.intratec.us