

nino-registrations-adult-overseas-nationals-feb-2016
nino-registrations-adult-overseas-nationals-feb-2016
nino-registrations-adult-overseas-nationals-feb-2016

You also want an ePaper? Increase the reach of your titles
YUMPU automatically turns print PDFs into web optimized ePapers that Google loves.
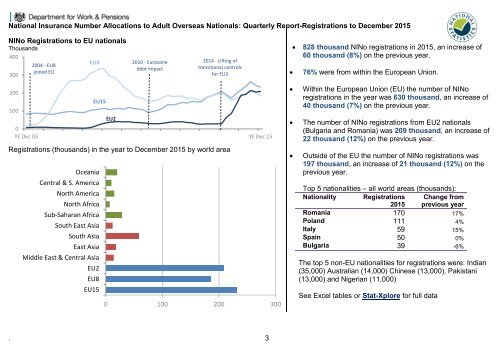
National Insurance Number Allocations to Adult Overseas Nationals: Quarterly Report-Registrations to December 2015<br />
NINo Registrations to EU <strong>nationals</strong><br />
Thousands<br />
400<br />
300<br />
2004 - EU8<br />
joined EU<br />
EU8<br />
2010 - Eurozone<br />
debt impact<br />
2014 - Lifting of<br />
transitional controls<br />
for EU2<br />
<br />
<br />
828 thousand NINo <strong>registrations</strong> in 2015, an increase of<br />
60 thousand (8%) on the previous year.<br />
76% were from within the European Union.<br />
200<br />
EU15<br />
100<br />
EU2<br />
0<br />
YE Dec 03 YE Dec 15<br />
Registrations (thousands) in the year to December 2015 by world area<br />
Oceania<br />
Central & S. America<br />
North America<br />
North Africa<br />
Sub-Saharan Africa<br />
South East Asia<br />
South Asia<br />
East Asia<br />
Middle East & Central Asia<br />
EU2<br />
EU8<br />
EU15<br />
0 100 200 300<br />
<br />
<br />
<br />
Within the European Union (EU) the number of NINo<br />
<strong>registrations</strong> in the year was 630 thousand, an increase of<br />
40 thousand (7%) on the previous year.<br />
The number of NINo <strong>registrations</strong> from EU2 <strong>nationals</strong><br />
(Bulgaria and Romania) was 209 thousand, an increase of<br />
22 thousand (12%) on the previous year.<br />
Outside of the EU the number of NINo <strong>registrations</strong> was<br />
197 thousand, an increase of 21 thousand (12%) on the<br />
previous year.<br />
Top 5 nationalities – all world areas (thousands):<br />
Nationality Registrations<br />
2015<br />
Change from<br />
previous year<br />
Romania 170 17%<br />
Poland 111 4%<br />
Italy 59 15%<br />
Spain 50 0%<br />
Bulgaria 39 -6%<br />
The top 5 non-EU nationalities for <strong>registrations</strong> were: Indian<br />
(35,000) Australian (14,000) Chinese (13,000), Pakistani<br />
(13,000) and Nigerian (11,000)<br />
See Excel tables or Stat-Xplore for full data<br />
. 3