

2015 CHILD POVERTY BC REPORT CARD
2015-BC-Child-Poverty-Report-Card-WebSmall-FirstCall-2015-11
2015-BC-Child-Poverty-Report-Card-WebSmall-FirstCall-2015-11

Create successful ePaper yourself
Turn your PDF publications into a flip-book with our unique Google optimized e-Paper software.
FACT<br />
SHEET<br />
1<br />
<strong>BC</strong>’s Child Poverty Rate Still 1 in 5<br />
<strong>BC</strong>’S <strong>CHILD</strong> <strong>POVERTY</strong> RATES<br />
British Columbia once again had child and overall poverty rates above the Canadian average in 2013,<br />
according to taxfiler data.<br />
1 out of 5<br />
<strong>BC</strong> children are poor<br />
– higher than the<br />
national average on<br />
both measures.<br />
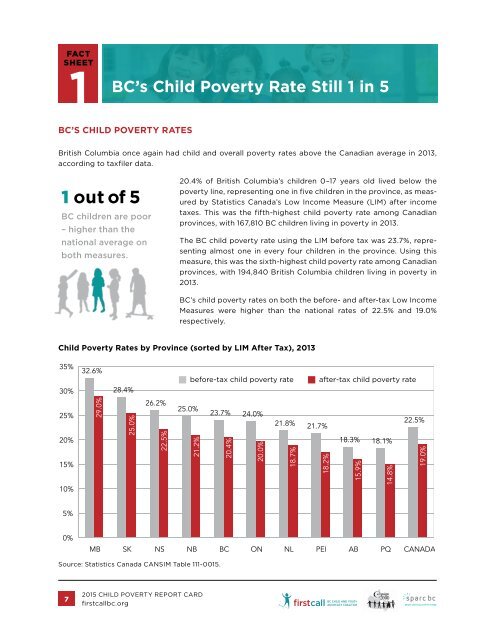
20.4% of British Columbia’s children 0–17 years old lived below the<br />
poverty line, representing one in five children in the province, as measured<br />
by Statistics Canada’s Low Income Measure (LIM) after income<br />
taxes. This was the fifth-highest child poverty rate among Canadian<br />
provinces, with 167,810 <strong>BC</strong> children living in poverty in 2013.<br />
The <strong>BC</strong> child poverty rate using the LIM before tax was 23.7%, representing<br />
almost one in every four children in the province. Using this<br />
measure, this was the sixth-highest child poverty rate among Canadian<br />
provinces, with 194,840 British Columbia children living in poverty in<br />
2013.<br />
<strong>BC</strong>’s child poverty rates on both the before- and after-tax Low Income<br />
Measures were higher than the national rates of 22.5% and 19.0%<br />
respectively.<br />
Child Poverty Rates by Province (sorted by LIM After Tax), 2013<br />
35%<br />
30%<br />
25%<br />
20%<br />
15%<br />
10%<br />
32.6%<br />
29.0%<br />
28.4%<br />
25.0%<br />
26.2%<br />
22.5%<br />
before-tax child poverty rate after-tax child poverty rate<br />
25.0%<br />
23.7% 24.0%<br />
21.8%<br />
22.5%<br />
21.7%<br />
21.2%<br />
20.4%<br />
20.0%<br />
18.7%<br />
18.2%<br />
18.3% 18.1%<br />
15.9%<br />
14.8%<br />
19.0%<br />
5%<br />
0%<br />
MB SK NS NB <strong>BC</strong> ON NL PEI AB PQ CANADA<br />
Source: Statistics Canada CANSIM Table 111-0015.<br />
7<br />
<strong>2015</strong> <strong>CHILD</strong> <strong>POVERTY</strong> <strong>REPORT</strong> <strong>CARD</strong><br />
firstcallbc.org