2012 PRESIDENTIAL GENERAL ELECTION RESULTS CANDIDATE NAME PARTY # OF VOTES % WASHINGTON (12 Electoral Votes) Obama, Barack D 1,755,396 56.16% Romney, Mitt R 1,290,670 41.29% Johnson, Gary LIB 42,202 1.35% Stein, Jill GRE 20,928 0.67% Goode, Virgil CON 8,851 0.28% Anderson, Ross C. "Rocky" JUS 4,946 0.16% Lindsay, Peta SLP 1,318 0.04% Harris, James SWP 1,205 0.04% Total State Votes: 3,125,516 WEST VIRGINIA (5 Electoral Votes) Romney, Mitt R 417,655 62.30% Obama, Barack D 238,269 35.54% Johnson, Gary LIB 6,302 0.94% Stein, Jill MTP 4,406 0.66% Terry, Randall NPA 3,806 0.57% Total State Votes: 670,438 WISCONSIN (10 Electoral Votes) Obama, Barack D 1,620,985 52.83% Romney, Mitt R 1,407,966 45.89% Johnson, Gary IND 20,439 0.67% Stein, Jill IND 7,665 0.25% Scattered W 5,170 0.17% Goode, Virgil CON 4,930 0.16% White, Jerry IND 553 0.02% La Riva, Gloria IND 526 0.02% Anderson, Ross C. "Rocky" W 112 0.00% Barr, Roseanne W 88 0.00% Total State Votes: 3,068,434 WYOMING (3 Electoral Votes) Romney, Mitt R 170,962 68.64% Obama, Barack D 69,286 27.82% Johnson, Gary LIB 5,326 2.14% Scattered W 2,035 0.82% Goode, Virgil H. CON 1,452 0.58% Total State Votes: 249,061 -40-
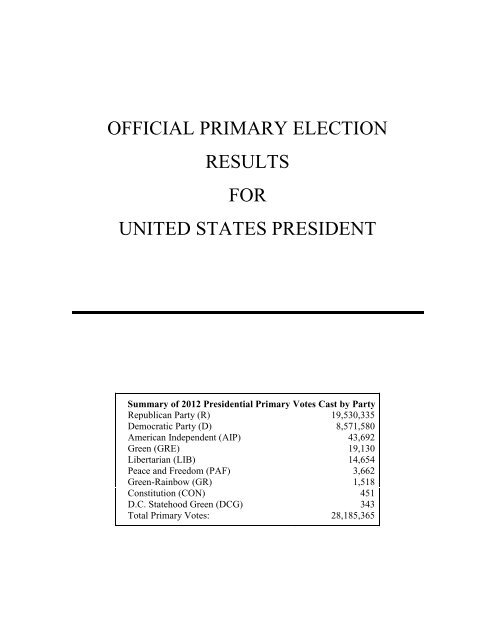
OFFICIAL PRIMARY ELECTION RESULTS FOR UNITED STATES PRESIDENT Summary of 2012 Presidential Primary Votes Cast by Party Republican Party (R) 19,530,335 Democratic Party (D) 8,571,580 American Independent (AIP) 43,692 Green (GRE) 19,130 Libertarian (LIB) 14,654 Peace and Freedom (PAF) 3,662 Green-Rainbow (GR) 1,518 Constitution (CON) 451 D.C. Statehood Green (DCG) 343 Total Primary Votes: 28,185,365