

Overview of the 340B Drug Pricing Program
1Mmfbin
1Mmfbin

Create successful ePaper yourself
Turn your PDF publications into a flip-book with our unique Google optimized e-Paper software.
Figure<br />
FIGURE<br />
2<br />
2<br />
Title here<br />
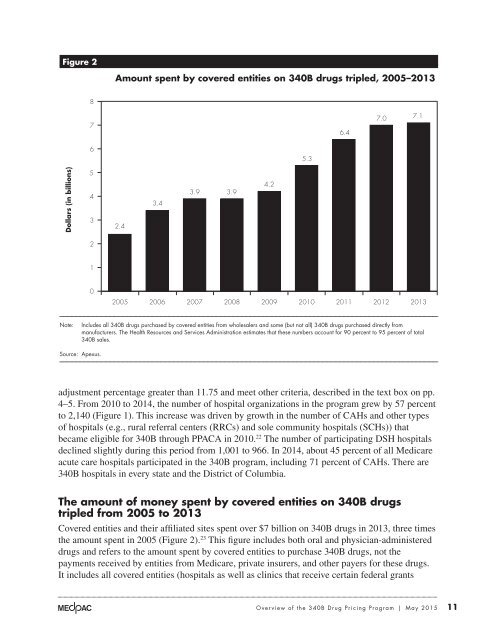
Amount spent by covered entities on <strong>340B</strong> drugs tripled, 2005–2013<br />
8<br />
7<br />
6.4<br />
7.0 7.1<br />
6<br />
5.3<br />
Dollars (in billions)<br />
5<br />
4<br />
3<br />
2.4<br />
3.4<br />
3.9 3.9<br />
4.2<br />
2<br />
1<br />
0<br />
2005<br />
2006<br />
2007<br />
2008<br />
2009<br />
2010<br />
2011<br />
2012<br />
2013<br />
Note: Includes all <strong>340B</strong> drugs purchased by covered entities from wholesalers and some (but not all) <strong>340B</strong> drugs purchased directly from<br />
manufacturers. The Health Resources and Services Administration estimates that <strong>the</strong>se numbers account for 90 percent to 95 percent <strong>of</strong> total<br />
<strong>340B</strong> sales.<br />
Note: Note and source are in InDesign<br />
Source: Apexus.<br />
adjustment percentage greater than 11.75 and meet o<strong>the</strong>r criteria, described in <strong>the</strong> text box on pp.<br />
4–5. From 2010 to 2014, <strong>the</strong> number <strong>of</strong> hospital organizations in <strong>the</strong> program grew by 57 percent<br />
to 2,140 (Figure 1). This increase was driven by growth in <strong>the</strong> number <strong>of</strong> CAHs and o<strong>the</strong>r types<br />
<strong>of</strong> hospitals (e.g., rural referral centers (RRCs) and sole community hospitals (SCHs)) that<br />
became eligible for <strong>340B</strong> through PPACA in 2010. 22 The number <strong>of</strong> participating DSH hospitals<br />
declined slightly during this period from 1,001 to 966. In 2014, about 45 percent <strong>of</strong> all Medicare<br />
acute care hospitals participated in <strong>the</strong> <strong>340B</strong> program, including 71 percent <strong>of</strong> CAHs. There are<br />
<strong>340B</strong> hospitals in every state and <strong>the</strong> District <strong>of</strong> Columbia.<br />
The amount <strong>of</strong> money spent by covered entities on <strong>340B</strong> drugs<br />
tripled from 2005 to 2013<br />
Covered entities and <strong>the</strong>ir affiliated sites spent over $7 billion on <strong>340B</strong> drugs in 2013, three times<br />
<strong>the</strong> amount spent in 2005 (Figure 2). 23 This figure includes both oral and physician-administered<br />
drugs and refers to <strong>the</strong> amount spent by covered entities to purchase <strong>340B</strong> drugs, not <strong>the</strong><br />
payments received by entities from Medicare, private insurers, and o<strong>the</strong>r payers for <strong>the</strong>se drugs.<br />
It includes all covered entities (hospitals as well as clinics that receive certain federal grants<br />
<strong>Overview</strong> <strong>of</strong> <strong>the</strong> <strong>340B</strong> <strong>Drug</strong> <strong>Pricing</strong> <strong>Program</strong> | May 2015 11