

Do Randomized Controlled Trials Meet the “Gold Standard”?
Do-randomized-controlled-trials-meet-the-gold-standard
Do-randomized-controlled-trials-meet-the-gold-standard

Create successful ePaper yourself
Turn your PDF publications into a flip-book with our unique Google optimized e-Paper software.
DO RANDOMIZED CONTROLLED TRIALS MEET THE “GOLD STANDARD”?<br />
ALAN GINSBURG AND MARSHALL S. SMITH<br />
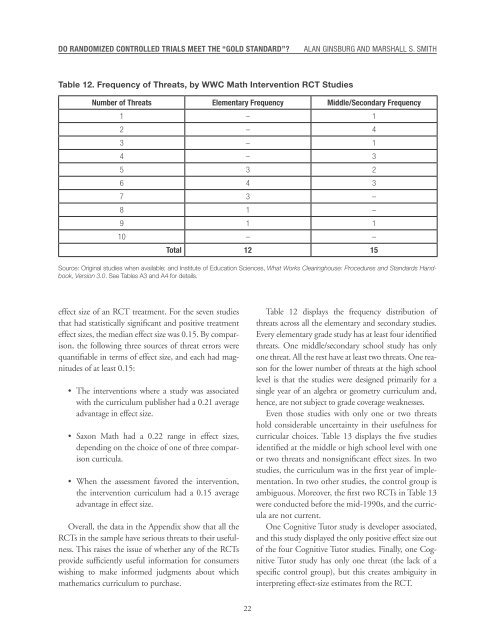
Table 12. Frequency of Threats, by WWC Math Intervention RCT Studies<br />
Number of Threats Elementary Frequency Middle/Secondary Frequency<br />
1 – 1<br />
2 – 4<br />
3 – 1<br />
4 – 3<br />
5 3 2<br />
6 4 3<br />
7 3 –<br />
8 1 –<br />
9 1 1<br />
10 – –<br />
Total 12 15<br />
Source: Original studies when available; and Institute of Education Sciences, What Works Clearinghouse: Procedures and Standards Handbook,<br />
Version 3.0. See Tables A3 and A4 for details.<br />
effect size of an RCT treatment. For <strong>the</strong> seven studies<br />
that had statistically significant and positive treatment<br />
effect sizes, <strong>the</strong> median effect size was 0.15. By comparison,<br />
<strong>the</strong> following three sources of threat errors were<br />
quantifiable in terms of effect size, and each had magnitudes<br />
of at least 0.15:<br />
• The interventions where a study was associated<br />
with <strong>the</strong> curriculum publisher had a 0.21 average<br />
advantage in effect size.<br />
• Saxon Math had a 0.22 range in effect sizes,<br />
depending on <strong>the</strong> choice of one of three comparison<br />
curricula.<br />
• When <strong>the</strong> assessment favored <strong>the</strong> intervention,<br />
<strong>the</strong> intervention curriculum had a 0.15 average<br />
advantage in effect size.<br />
Overall, <strong>the</strong> data in <strong>the</strong> Appendix show that all <strong>the</strong><br />
RCTs in <strong>the</strong> sample have serious threats to <strong>the</strong>ir usefulness.<br />
This raises <strong>the</strong> issue of whe<strong>the</strong>r any of <strong>the</strong> RCTs<br />
provide sufficiently useful information for consumers<br />
wishing to make informed judgments about which<br />
ma<strong>the</strong>matics curriculum to purchase.<br />
Table 12 displays <strong>the</strong> frequency distribution of<br />
threats across all <strong>the</strong> elementary and secondary studies.<br />
Every elementary grade study has at least four identified<br />
threats. One middle/secondary school study has only<br />
one threat. All <strong>the</strong> rest have at least two threats. One reason<br />
for <strong>the</strong> lower number of threats at <strong>the</strong> high school<br />
level is that <strong>the</strong> studies were designed primarily for a<br />
single year of an algebra or geometry curriculum and,<br />
hence, are not subject to grade coverage weaknesses.<br />
Even those studies with only one or two threats<br />
hold considerable uncertainty in <strong>the</strong>ir usefulness for<br />
curricular choices. Table 13 displays <strong>the</strong> five studies<br />
identified at <strong>the</strong> middle or high school level with one<br />
or two threats and nonsignificant effect sizes. In two<br />
studies, <strong>the</strong> curriculum was in <strong>the</strong> first year of implementation.<br />
In two o<strong>the</strong>r studies, <strong>the</strong> control group is<br />
ambiguous. Moreover, <strong>the</strong> first two RCTs in Table 13<br />
were conducted before <strong>the</strong> mid-1990s, and <strong>the</strong> curricula<br />
are not current.<br />
One Cognitive Tutor study is developer associated,<br />
and this study displayed <strong>the</strong> only positive effect size out<br />
of <strong>the</strong> four Cognitive Tutor studies. Finally, one Cognitive<br />
Tutor study has only one threat (<strong>the</strong> lack of a<br />
specific control group), but this creates ambiguity in<br />
interpreting effect-size estimates from <strong>the</strong> RCT.<br />
22
