

IJAAR-V8No2-p95-103

Create successful ePaper yourself
Turn your PDF publications into a flip-book with our unique Google optimized e-Paper software.
Int. J. Agri. Agri. R.<br />
The expected variability observed in the population<br />
tested is caused by the genetic factors. Selection will<br />
be efficient when conducted in populations that have<br />
large genetic variability (Phoelman and Sleeper,<br />
2006). Therefore, it is important to estimate the<br />
variance components and heritability value of RILs F5<br />
in order to know the genetic variability contribution<br />
to the variability of phenotypes.<br />
The advanced generation RILs F5 resulted from SSD<br />
can retain the genetic variability. This is evidenced by<br />
the majority of agronomic characters in RILs F5 have<br />
a broad genetic diversity and high heritability (Table<br />
4). According to Roy (2000), the advanced generation<br />
SSD can retain genetic variablity as the earlier<br />
generations and the advanced lines have high<br />
variability among lines with low variability within<br />
lines.<br />
The characters that have broad genetic variability and<br />
high heritability estimates in the advanced generation<br />
of SSD indicate that the characters are influenced by<br />
additives gene action. According to Mangoendidjojo<br />
(2003), in the population of SSD, selection is delayed<br />
until the advanced generation, this resulted in the<br />
fixation of additive genes. This makes the value of h 2 bs<br />
as a good estimate of the h 2 ns. According to Suprapto<br />
and Kairudin (2007), a high heritability is useful in<br />
the selection if the genetic variance is mainly consists<br />
of additive genes because the additive effect of each<br />
allele will be inherited from the parents to the<br />
progenies.<br />
In general, the observed character has a predictive<br />
value of a positive selection gain (Table 4). This<br />
indicates an improvement in mean values in the next<br />
generation. According to Falconer and Mackay<br />
(1996), the hight value of selection gain reflects the<br />
improvement of the character achieved when<br />
selection is conducted. The higher the value of<br />
expected selection gain of a character the more<br />
effective the selection. The estimation of selection<br />
gain for plant height and weight of grain panicle -1<br />
showed the highest estimated value of selection gain<br />
(Table 4).<br />
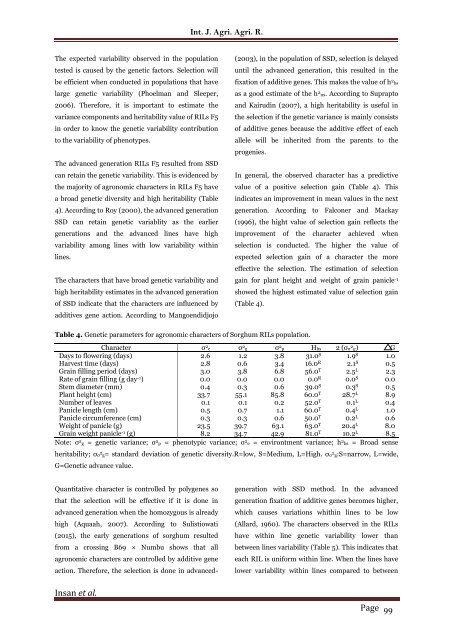
Table 4. Genetic parameters for agronomic characters of Sorghum RILs population.<br />
Character σ 2 e σ 2 g σ 2 p Hbs 2 (σσ 2 g) G<br />
Days to flowering (days) 2.6 1.2 3.8 31.0 S 1.9 S 1.0<br />
Harvest time (days) 2.8 0.6 3.4 16.0 R 2.1 S 0.5<br />
Grain filling period (days) 3.0 3.8 6.8 56.0 T 2.5 L 2.3<br />
Rate of grain filling (g day -1 ) 0.0 0.0 0.0 0.0 R 0.0 S 0.0<br />
Stem diameter (mm) 0.4 0.3 0.6 39.0 S 0.3 S 0.5<br />
Plant height (cm) 33.7 55.1 85.8 60.0 T 28.7 L 8.9<br />
Number of leaves 0.1 0.1 0.2 52.0 T 0.1 L 0.4<br />
Panicle length (cm) 0.5 0.7 1.1 60.0 T 0.4 L 1.0<br />
Panicle circumference (cm) 0.3 0.3 0.6 50.0 T 0.2 L 0.6<br />
Weight of panicle (g) 23.5 39.7 63.1 63.0 T 20.4 L 8.0<br />
Grain weight panicle -1 (g) 8.2 34.7 42.9 81.0 T 10.2 L 8.5<br />
Note: σ 2 g = genetic variance; σ 2 p = phenotypic variance; σ 2 e = environtment variance; h 2 bs = Broad sense<br />
heritability; σσ 2 g= standard deviation of genetic diversity.R=low, S=Medium, L=High. σσ 2 g:S=narrow, L=wide,<br />
G=Genetic advance value.<br />
Quantitative character is controlled by polygenes so<br />
that the selection will be effective if it is done in<br />
advanced generation when the homozygous is already<br />
high (Aquaah, 2007). According to Sulistiowati<br />
(2015), the early generations of sorghum resulted<br />
from a crossing B69 × Numbu shows that all<br />
agronomic characters are controlled by additive gene<br />
action. Therefore, the selection is done in advancedgeneration<br />
with SSD method. In the advanced<br />
generation fixation of additive genes becomes higher,<br />
which causes variations whithin lines to be low<br />
(Allard, 1960). The characters observed in the RILs<br />
have within line genetic variability lower than<br />
between lines variability (Table 5). This indicates that<br />
each RIL is uniform within line. When the lines have<br />
lower variability within lines compared to between<br />
Insan et al.<br />
Page 99


