
Create successful ePaper yourself
Turn your PDF publications into a flip-book with our unique Google optimized e-Paper software.
According to the Secretary of<br />
State, only 72.7% of California’s<br />
24 million eligible voters<br />
in 2015 registered to vote, a percentage<br />
that hasn’t changed much since the<br />
2012 presidential election (72.58%).<br />
But since then, the number of both registered<br />
democratic and republic voters<br />
have slightly decreased, while the number<br />
of independent voters has grown<br />
significantly. The latest numbers show<br />
that of California’s registered voters,<br />
43.2% (7.6 million) identify as democratic,<br />
and 28.0% (4.9 million) identify<br />
as republican. Meanwhile, the percentage<br />
of independent registered voters<br />
has increased from 19.5% in 2008 to<br />
23.6% in 2015.<br />
The surging number of independents<br />
are nearly equally split at 37%<br />
democrats and 34% republicans.<br />
Republicans are more cohesive as a voting<br />
block than democrats. Democrats,<br />
on the other hand, are more susceptible<br />
to peeling off into issue specific voting<br />
blocks. In fact, there is enough ideological<br />
diversity within the complex personal<br />
political mix in California that gun<br />
rights issues do motivate certain segments<br />
of pro-self-defense conservatism<br />
in moderate voters, and can even motivate<br />
some democratic voters to vote to<br />
defend gun owner’s rights.<br />
Although 43.2% of registered Cal-<br />
ifornia voters generally vote democratic,<br />
Californians (including democrats<br />
and non-voters) nonetheless hold some<br />
important core conservative beliefs that<br />
dictate their voting decisions in most<br />
parts of the state, even in parts of the<br />
state where democrats hold a majority.<br />
On an ideological scale ranging from<br />
strong conservative to strong liberal,<br />
public opinion data shows the average<br />
Californian in the middle, and even<br />
leaning slightly conservative. For example,<br />
54% of California’s likely voters<br />
would prefer paying down the states<br />
debt, while only 42% would prefer to<br />
restore funding to social services. And<br />
both 49% of non-Hispanic white and<br />
53% of African American voters are<br />
more likely to say that immigrants are a<br />
burden on the state rather than a benefit.<br />
Getting this mix of voters to the polls<br />
is possible. If gun owners were motivated<br />
to engage in the process, it could<br />
easily result in the defeat of anti-gun<br />
political candidates and ill-conceived<br />
gun control efforts like Newsom’s ballot<br />
measure and other gun bans recently<br />
introduced in Sacramento.<br />
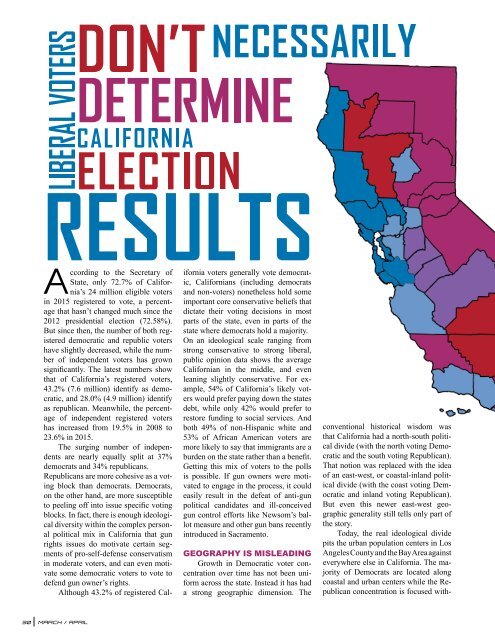
GEOGRAPHY IS MISLEADING<br />
Growth in Democratic voter concentration<br />
over time has not been uniform<br />
across the state. Instead it has had<br />
a strong geographic dimension. The<br />
conventional historical wisdom was<br />
that California had a north-south political<br />
divide (with the north voting Democratic<br />
and the south voting Republican).<br />
That notion was replaced with the idea<br />
of an east-west, or coastal-inland political<br />
divide (with the coast voting Democratic<br />
and inland voting Republican).<br />
But even this newer east-west geographic<br />
generality still tells only part of<br />
the story.<br />
Today, the real ideological divide<br />
pits the urban population centers in Los<br />
Angeles County and the Bay Area against<br />
everywhere else in California. The majority<br />
of Democrats are located along<br />
coastal and urban centers while the Republican<br />
concentration is focused with-<br />
30<br />
MARCH / APRIL