

Irish Grassland Association
iga_summer_2016
iga_summer_2016

Create successful ePaper yourself
Turn your PDF publications into a flip-book with our unique Google optimized e-Paper software.
Table 1. Average feed, grazing season length and milk production performance of spring<br />
milk producers with varying proportions of grass in the diet of the dairy herd (2008-2011).<br />
Table 1. Average feed, grazing season length and milk production performance of spring milk producers with<br />
varying proportions of grass in the diet of the dairy herd (2008-2011). Grass rich<br />
Grass poor<br />
System number 1 2 3 4<br />
Grass rich<br />
Grass poor<br />
No. of farms 425 1,630 571 124<br />
Home System grown number grass in the diet (% of total 92.0 1 85.1 2 76.23 65.7 4<br />
feed consumed by the dairy herd)<br />
No. of farms 425 1,630 571 124<br />
Meal fed (kg DM/cow) 0.36 0.66 0.99 1.31<br />
Home grown grass in the diet (% of total feed<br />
Grass used (t DM/ha) 8.5 92.0 8.1 85.1 7.676.2 6.8 65.7<br />
consumed by the dairy herd)<br />
Overall stocking rate (LU/ha) 2.02 2.04 2.10 2.12<br />
Meal fed (kg DM/cow) 0.36 0.66 0.99 1.31<br />
Milking platform stocking rate (cows/ha) 2.06 2.15 2.28 2.27<br />
Grazing Grass used season (t DM/ha) (full-time days) 270 8.5 257 8.1 2507.6 244 6.8<br />
Milk yield (litres/cow) 4,679 4,974 5,192 5,577<br />
Overall stocking rate (LU/ha) 2.02 2.04 2.10 2.12<br />
Milk yield (kg Milk Solids/ha) 723 769 823 883<br />
Milking platform stocking rate (cows/ha) 2.06 2.15 2.28 2.27<br />
Grazing season (full-time days) 270 257 250 244<br />
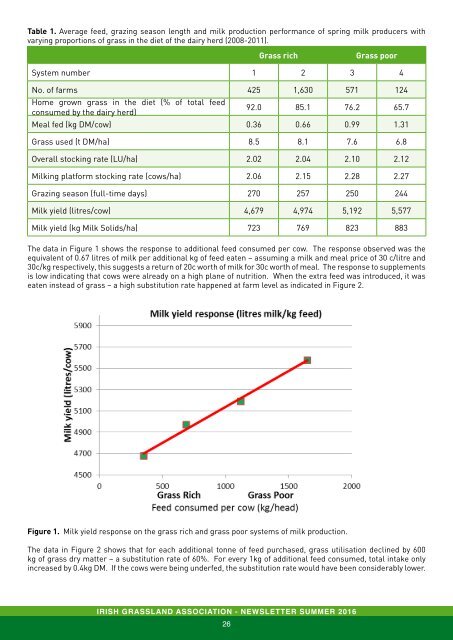
The data in Figure 1 shows the response to additional feed consumed per cow. The response<br />
observed Milk yield (litres/cow) was the equivalent of 0.67 litres of milk per 4,679 additional 4,974 kg of feed 5,192 eaten – assuming 5,577<br />
a Milk milk yield and (kg meal Milk price Solids/ha) of 30 c/litre and 30c/kg respectively, 723 this suggests 769 a return 823 of 20c 883 worth<br />
of milk for 30c worth of meal. The response to supplements is low indicating that cows were<br />
The data in Figure 1 shows the response to additional feed consumed per cow. The response observed was the<br />
already on a high plane of nutrition. When the extra feed was introduced, it was eaten instead<br />
equivalent of 0.67 litres of milk per additional kg of feed eaten – assuming a milk and meal price of 30 c/litre and<br />
30c/kg of grass respectively, – a high this substitution suggests a return rate happened of 20c worth at of farm milk for level 30c as worth indicated of meal. in The Figure response 2. to supplements<br />
is low indicating that cows were already on a high plane of nutrition. When the extra feed was introduced, it was<br />
eaten instead of grass – a high substitution rate happened at farm level as indicated in Figure 2.<br />
Figure 1. Milk yield response on the grass rich and grass poor systems of milk production.<br />
Figure 1. Milk yield response on the grass rich and grass poor systems of milk production.<br />
The data in Figure 2 shows that for each additional tonne of feed purchased, grass utilisation declined by 600<br />
kg of grass dry matter – a substitution rate of 60%. For every 1kg of additional feed consumed, total intake only<br />
increased by 0.4kg DM. If the cows were being underfed, the substitution rate would have been considerably lower.<br />
additional feed consumed, total intake only increased by 0.4kg DM. If the cows were being<br />
underfed, the substitution rate would have been considerably lower.<br />
Figure 2. Pasture utilisation on the grass rich and grass poor systems of milk production.<br />
Figure 2. Pasture utilisation on the grass rich and grass poor systems of milk production.<br />
Financial performance<br />
What then are the implications for financial performance? Table 2 shows that on average, grass poor<br />
systems of milk production generate more output per hectare but are less profitable.<br />
Financial performance<br />
Table 2. Average financial performance of spring milk producers with varying proportions of grass in the<br />
diet of the dairy herd (2008-2011).<br />
Grass rich<br />
Grass poor<br />
System number 1 2 3 4<br />
No. profitable.<br />
farms 425 1,630 571 124<br />
Per litre (cent)<br />
Milk price<br />
31.3 31.0 30.8 30.5<br />
Gross grass output in the diet of the dairy herd (2008-2011). 31.6 31.3 31.1 30.9<br />
Total costs<br />
18.0 19.2 20.7 22.1<br />
Net margin<br />
13.6 Grass 12.1 rich 10.4 Grass 8.8 poor<br />
Per System hectare number (€)<br />
1 2 3 4<br />
Gross No. output of farms 2,958425 3,189 1,630 3,412 571 3,651 124<br />
Total Per costs litre (cent)<br />
1,660 1,932 2,231 2,568<br />
Net Milk margin price<br />
1,29831.3<br />
1,257 31.0 1,180 30.8 1,083 30.5<br />
% of Gross farms output making over €2,000/ha 21 31.6 20 31.3 15 31.1 6 30.9<br />
Total costs<br />
18.0 19.2 20.7 22.1<br />
The data Net margin Table 2 shows that higher output did not increase 13.6net profit on 12.1 either a per litre 10.4 or per hectare 8.8<br />
basis. Reducing the grass content of the diet increased total costs per litre – variable costs, particularly<br />
the feed<br />
Per hectare<br />
costs jumped<br />
(€)<br />
while fixed costs remained static. On either a per cow (not shown) or a per<br />
hectare Gross basis, output both variable and fixed costs increased. This 2,958increase was 3,189 greater than 3,412 the increase in 3,651<br />
gross Total output costs and so the net margin (the margin remaining 1,660 to pay the farmer, 1,932 bank principle 2,231 and taxation) 2,568<br />
was €200/ha Net margin lower in the grass poor system compared with 1,298 the grass rich 1,257 systems of milk 1,180production.<br />
1,083<br />
% of farms making over €2,000/ha 21 20 15 6<br />
It seemed surprising that a milk yield response of 0.67 litres/kg of additional purchased feed was not<br />
profitable when the four years of the study are taken into consideration. The reason for this is explained<br />
in Figure 3 where we look at what tends to happen as farmers increase feed input.<br />
Spending on the grass poor doesn’t stop at just meal and forage purchase. For every €100 spent on feed<br />
(meals and forage), an average of an additional €60 was spent on other costs on the grass poor farms.<br />
What then are the implications for financial performance? Table 2 shows that on average,<br />
grass poor systems of milk production generate more output per hectare but are less<br />
Table 2. Average financial performance of spring milk producers with varying proportions of<br />
SECTION<br />
4<br />
technical<br />
focus<br />
<strong>Irish</strong> <strong>Grassland</strong> <strong>Association</strong> - newsletter summer 2016<br />
26<br />
<strong>Irish</strong> <strong>Grassland</strong> <strong>Association</strong> - newsletter summer 2016<br />
27