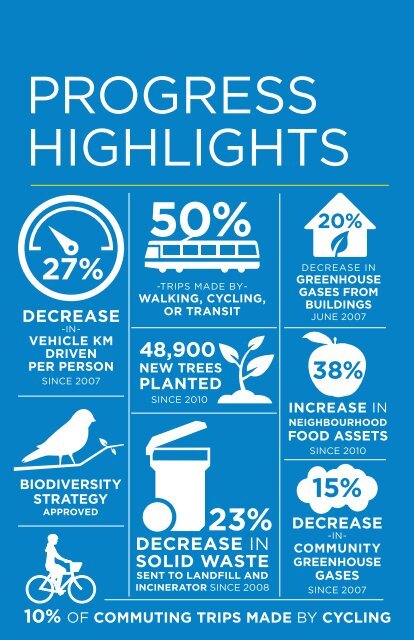
PROGRESS HIGHLIGHTS 27% DECREASE -IN- VEHICLE KM DRIVEN PER PERSON SINCE 2007 BIODIVERSITY STRATEGY APPROVED 50% -TRIPS MADE BY- WALKING, CYCLING, OR TRANSIT 48,900 NEW TREES PLANTED SINCE 2010 23% DECREASE IN SOLID WASTE SENT TO LANDFILL AND INCINERATOR SINCE 2008 20% DECREASE IN GREENHOUSE GASES FROM BUILDINGS JUNE 2007 38% INCREASE IN NEIGHBOURHOOD FOOD ASSETS SINCE 2010 15% DECREASE -IN- COMMUNITY GREENHOUSE GASES SINCE 2007 10% OF COMMUTING TRIPS MADE BY CYCLING 4
GOAL AND TARGETS INDICATOR BASELINE 2015 CHANGE FROM BASELINE IMPROVED OVER BASELINE 2020 TARGET CLIMATE AND RENEWABLES DASH- BOARD Target 1: Reduce community-based greenhouse gas emissions by 33% from 2007 levels. GREEN BUILDINGS Target 1: Require all buildings constructed from 2020 onward to be carbon neutral in operations. Target 2: Reduce energy use and GHG emissions in existing buildings by 20% from 2007 levels. GREEN TRANSPORTATION Target 1: Make the majority of trips (over 50%) by foot, bicycle and public transit. Target 2: Reduce average distance driven per resident by 20% from 2007 levels. ZERO WASTE Total tonnes of community CO 2 e emissions from Vancouver Kilograms of CO 2 e per square metre of newly built floor area Total tonnes of CO 2 e from all community buildings 2,850,000 tCO 2 e 2,410,000 tCO 2 e -15% Yes 1,910,000 tCO 2 e (2007) 1 20.7 kgCO 2 e/m 2 (2007) 14.4 kgCO 2 e/m 2 (2014) -30% Yes carbon neutral 1,625,000 tCO 2 e 1,295,000 tCO 2 e -20% Yes 1,300,000 (2007) 2 tCO 2 e Per cent mode share by walk, bike and transit 40% 3 50% of trips +10% 3 Yes 50% of trips Total vehicle km driven per person 5,950 km (2007) 4,319 km -27% Yes 4,760 km Target 1: Reduce total solid waste going to the landfill or incinerator by 50% from 2008 levels. Annual solid waste disposed to landfill and incinerator from Vancouver 480,000 tonnes (2008) 370,000 tonnes -23% Yes 240,000 tonnes (2014) 4 ACCESS TO NATURE Target 1: Ensure that every person lives within a five-minute walk of a park, greenway or other green space. Per cent of city’s land base within a five-min walk to a green space 92.6% (2010) 92.7% +0.1% Yes 95% 5 Target 2: Plant 150,000 additional trees. Total number of additional trees planted - - (2010) 48,900 trees +48,900 Yes 150,000 trees 1 Emissions for baseline and subsequent years have been revised due to updated methods for calculating emissions from buildings (see Green Buildings section) and the Vancouver Landfill (see Climate Leadership section on landfill gas capture). 2 Emissions for baseline and subsequent years have been revised due to a correction in FortisBC’s data set around which buildings fall within city limits. Totals now also include industrial buildings. This metric previously included only residential and commercial buildings. 3 Mode share totals for baseline year (40% of trips in 2008) was based on data gathered through a TransLink “Trip Diary” survey that is conducted about once every five years. To obtain more regular statistics, the City began an annual survey of Vancouver residents that is slightly different in methodology but is believed to better capture the full range of travel by residents. This will be used to measure Green Transportation indicators going forward. 4 Solid waste data is compiled first at a regional level and then at the city level. As a result, Vancouver’s data is always one year behind the reporting period. 5 5% of the city’s land-base is industrial land area, and is not considered part of the target. 6 Food assets include: number of community garden plots, farmers markets, community orchards, community composting facilities, community kitchens, community produce stands, and urban farms. 7 Air quality metrics are measured by Metro Vancouver from data from two monitoring stations in Vancouver: one in Kitsilano and one at Robson Square. Four indicators of air quality are used for comparison to world standards. They are: 24-hour average particulate matter (PM2.5) concentration >25 μg/m 3 , one-hour average nitrogen dioxide (NO 2 ) concentration >200 μg/m 3 , 24-hour average sulphur dioxide (SO 2 ) concentration >20 μg/m 3 ,and eight hour ground-level ozone (O 3 ) concentration >52 ppb. 8 New green jobs and greening business surveys will be conducted in 2016. Target 3: Restore or enhance 25 hectares of natural areas between 2010 and 2020. Target 4: Increase canopy cover to 22% by 2050. CLEAN WATER Target 1: Meet or beat the most stringent of British Columbian, Canadian and appropriate international drinking water quality standards and guidelines. Target 2: Reduce per-capita water consumption by 33% from 2006 levels. LOCAL FOOD Target: Increase city-wide and neighbourhood food assets by a minimum of 50% over 2010 levels. CLEAN AIR Target: Meet or beat the most stringent air quality guidelines from Metro Vancouver, BC, Canada, and the World Health Organization. GREEN ECONOMY Target 1: Double the number of green jobs over 2010 levels. Target 2: Double the number of companies that are actively engaged in greening their operations over 2011 levels. LIGHTER FOOTPRINT Total hectares of natural areas restored or enhanced Per cent of city’s land area covered by tree-leaf canopies Total number of instances of not meeting drinking water quality standards Total water consumption per capita Total number of neighbourhood food assets 6 in Vancouver Total number of instances of not meeting of air quality standards for ozone, particulate matter (PM 2.5), nitrogen dioxide and sulphur dioxide from both the Kitsilano and Downtown stations combined 7 Total number of green jobs Per cent of businesses engaged in greening their operations - - (2010) 14 hectares +14 Yes 25 hectares 18% (2013) Survey to be conducted in 2017 0 instances (2006) 583 L/person/ day (2006) 3,344 food assets (2010) 27 instances (2008) 16,700 jobs (2010) 5% of businesses engaged (2011) - - - - 22% (2050) 0 instances 0 Yes 0 instances 493 L/person/ day -15% Yes 390 L/person/ day 4,612 food assets +38% Yes 5,158 food assets 3 instances -89% Yes 0 instances 19,900 jobs 19% Yes 33,400 jobs (2013) 8 Survey to be - - - - 10% of 2016 8 engaged conducted in businesess 9 “People empowered to take action” are defined as those who are enabled by City-supported programs to change their lifestyle or are implementing a community project that helps Vancouver achieve its Greenest City goals as a result of support provided by a City-led or City-supported program. Examples include learning to preserve food or ride a bike in a community centre class, as well as people involved in projects supported by the Vancouver Foundation and City of Vancouver Greenest City Fund. The definition excludes people participating in a dialogue or consultation, attending an event, using infrastructure (e.g., bike lanes, food scraps collection), or receiving a personal incentive (e.g., home energy retrofits). Target: Reduce Vancouver’s ecological footprint by 33% over 2006 levels. Proxy: Number of people empowered 9 by a City-led or City-supported project to take personal action in support of a Greenest City goal and/or to reduce levels of consumption (cumulative) 600 people (2011) 13,400 people +12,800 Yes To be determined