

compressed.tracemonkey-pldi-09

Create successful ePaper yourself
Turn your PDF publications into a flip-book with our unique Google optimized e-Paper software.
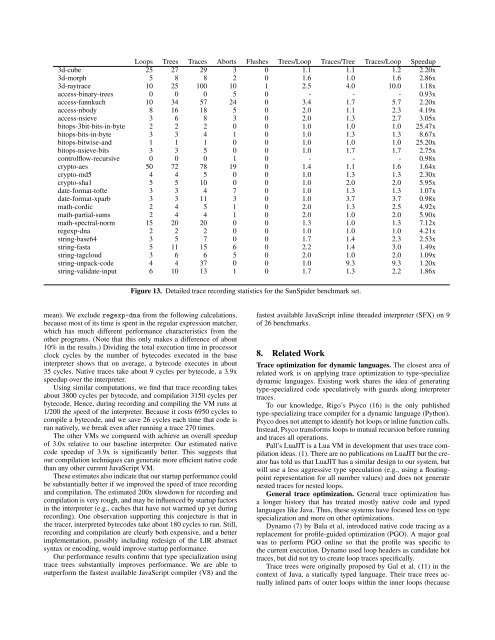
Loops Trees Traces Aborts Flushes Trees/Loop Traces/Tree Traces/Loop Speedup<br />
3d-cube 25 27 29 3 0 1.1 1.1 1.2 2.20x<br />
3d-morph 5 8 8 2 0 1.6 1.0 1.6 2.86x<br />
3d-raytrace 10 25 100 10 1 2.5 4.0 10.0 1.18x<br />
access-binary-trees 0 0 0 5 0 - - - 0.93x<br />
access-fannkuch 10 34 57 24 0 3.4 1.7 5.7 2.20x<br />
access-nbody 8 16 18 5 0 2.0 1.1 2.3 4.19x<br />
access-nsieve 3 6 8 3 0 2.0 1.3 2.7 3.05x<br />
bitops-3bit-bits-in-byte 2 2 2 0 0 1.0 1.0 1.0 25.47x<br />
bitops-bits-in-byte 3 3 4 1 0 1.0 1.3 1.3 8.67x<br />
bitops-bitwise-and 1 1 1 0 0 1.0 1.0 1.0 25.20x<br />
bitops-nsieve-bits 3 3 5 0 0 1.0 1.7 1.7 2.75x<br />
controlflow-recursive 0 0 0 1 0 - - - 0.98x<br />
crypto-aes 50 72 78 19 0 1.4 1.1 1.6 1.64x<br />
crypto-md5 4 4 5 0 0 1.0 1.3 1.3 2.30x<br />
crypto-sha1 5 5 10 0 0 1.0 2.0 2.0 5.95x<br />
date-format-tofte 3 3 4 7 0 1.0 1.3 1.3 1.07x<br />
date-format-xparb 3 3 11 3 0 1.0 3.7 3.7 0.98x<br />
math-cordic 2 4 5 1 0 2.0 1.3 2.5 4.92x<br />
math-partial-sums 2 4 4 1 0 2.0 1.0 2.0 5.90x<br />
math-spectral-norm 15 20 20 0 0 1.3 1.0 1.3 7.12x<br />
regexp-dna 2 2 2 0 0 1.0 1.0 1.0 4.21x<br />
string-base64 3 5 7 0 0 1.7 1.4 2.3 2.53x<br />
string-fasta 5 11 15 6 0 2.2 1.4 3.0 1.49x<br />
string-tagcloud 3 6 6 5 0 2.0 1.0 2.0 1.<strong>09</strong>x<br />
string-unpack-code 4 4 37 0 0 1.0 9.3 9.3 1.20x<br />
string-validate-input 6 10 13 1 0 1.7 1.3 2.2 1.86x<br />
Figure 13. Detailed trace recording statistics for the SunSpider benchmark set.<br />
mean). We exclude regexp-dna from the following calculations,<br />
because most of its time is spent in the regular expression matcher,<br />
which has much different performance characteristics from the<br />
other programs. (Note that this only makes a difference of about<br />
10% in the results.) Dividing the total execution time in processor<br />
clock cycles by the number of bytecodes executed in the base<br />
interpreter shows that on average, a bytecode executes in about<br />
35 cycles. Native traces take about 9 cycles per bytecode, a 3.9x<br />
speedup over the interpreter.<br />
Using similar computations, we find that trace recording takes<br />
about 3800 cycles per bytecode, and compilation 3150 cycles per<br />
bytecode. Hence, during recording and compiling the VM runs at<br />
1/200 the speed of the interpreter. Because it costs 6950 cycles to<br />
compile a bytecode, and we save 26 cycles each time that code is<br />
run natively, we break even after running a trace 270 times.<br />
The other VMs we compared with achieve an overall speedup<br />
of 3.0x relative to our baseline interpreter. Our estimated native<br />
code speedup of 3.9x is significantly better. This suggests that<br />
our compilation techniques can generate more efficient native code<br />
than any other current JavaScript VM.<br />
These estimates also indicate that our startup performance could<br />
be substantially better if we improved the speed of trace recording<br />
and compilation. The estimated 200x slowdown for recording and<br />
compilation is very rough, and may be influenced by startup factors<br />
in the interpreter (e.g., caches that have not warmed up yet during<br />
recording). One observation supporting this conjecture is that in<br />
the tracer, interpreted bytecodes take about 180 cycles to run. Still,<br />
recording and compilation are clearly both expensive, and a better<br />
implementation, possibly including redesign of the LIR abstract<br />
syntax or encoding, would improve startup performance.<br />
Our performance results confirm that type specialization using<br />
trace trees substantially improves performance. We are able to<br />
outperform the fastest available JavaScript compiler (V8) and the<br />
fastest available JavaScript inline threaded interpreter (SFX) on 9<br />
of 26 benchmarks.<br />
8. Related Work<br />
Trace optimization for dynamic languages. The closest area of<br />
related work is on applying trace optimization to type-specialize<br />
dynamic languages. Existing work shares the idea of generating<br />
type-specialized code speculatively with guards along interpreter<br />
traces.<br />
To our knowledge, Rigo’s Psyco (16) is the only published<br />
type-specializing trace compiler for a dynamic language (Python).<br />
Psyco does not attempt to identify hot loops or inline function calls.<br />
Instead, Psyco transforms loops to mutual recursion before running<br />
and traces all operations.<br />
Pall’s LuaJIT is a Lua VM in development that uses trace compilation<br />
ideas. (1). There are no publications on LuaJIT but the creator<br />
has told us that LuaJIT has a similar design to our system, but<br />
will use a less aggressive type speculation (e.g., using a floatingpoint<br />
representation for all number values) and does not generate<br />
nested traces for nested loops.<br />
General trace optimization. General trace optimization has<br />
a longer history that has treated mostly native code and typed<br />
languages like Java. Thus, these systems have focused less on type<br />
specialization and more on other optimizations.<br />
Dynamo (7) by Bala et al, introduced native code tracing as a<br />
replacement for profile-guided optimization (PGO). A major goal<br />
was to perform PGO online so that the profile was specific to<br />
the current execution. Dynamo used loop headers as candidate hot<br />
traces, but did not try to create loop traces specifically.<br />
Trace trees were originally proposed by Gal et al. (11) in the<br />
context of Java, a statically typed language. Their trace trees actually<br />
inlined parts of outer loops within the inner loops (because