

Hunger
Hunger_On_Campus
Hunger_On_Campus

Create successful ePaper yourself
Turn your PDF publications into a flip-book with our unique Google optimized e-Paper software.
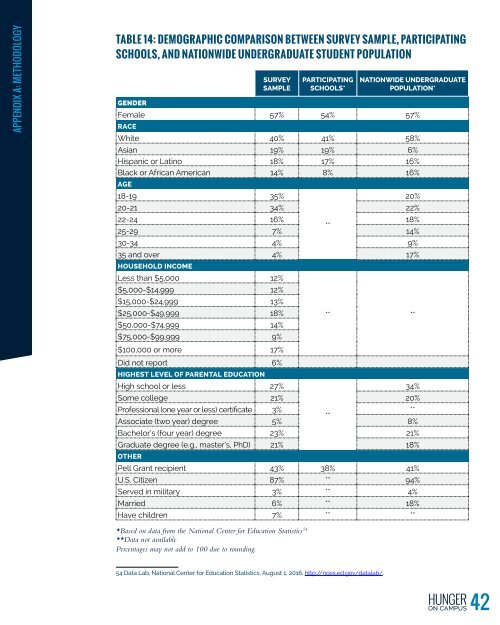
Appendix A: Methodology<br />
Table 14: Demographic Comparison between Survey Sample, Participating<br />
Schools, and Nationwide Undergraduate Student Population<br />
Gender<br />
Survey<br />
Sample<br />
Participating<br />
Schools*<br />
Nationwide Undergraduate<br />
Population*<br />
Female 57% 54% 57%<br />
Race<br />
White 40% 41% 58%<br />
Asian 19% 19% 6%<br />
Hispanic or Latino 18% 17% 16%<br />
Black or African American 14% 8% 16%<br />
Age<br />
18-19 35%<br />
20-21 34% 22%<br />
22-24 16% 18%<br />
**<br />
25-29 7% 14%<br />
30-34 4% 9%<br />
35 and over 4% 17%<br />
Household Income<br />
Less than $5,000 12%<br />
$5,000-$14,999 12%<br />
$15,000-$24,999 13%<br />
$25,000-$49,999 18%<br />
$50,000-$74,999 14%<br />
$75,000-$99,999 9%<br />
$100,000 or more 17%<br />
Did not report 6%<br />
Highest Level of Parental Education<br />
High school or less 27%<br />
20%<br />
** **<br />
Some college 21% 20%<br />
Professional (one year or less) certificate 3% **<br />
**<br />
Associate (two year) degree 5% 8%<br />
Bachelor’s (four year) degree 23% 21%<br />
Graduate degree (e.g., master’s, PhD) 21% 18%<br />
Other<br />
Pell Grant recipient 43% 38% 41%<br />
U.S. Citizen 87% ** 94%<br />
Served in military 3% ** 4%<br />
Married 6% ** 18%<br />
Have children 7% ** **<br />
34%<br />
*Based on data from the National Center for Education Statistics 54<br />
**Data not available<br />
Percentages may not add to 100 due to rounding.<br />
54 Data Lab, National Center for Education Statistics, August 1, 2016, http://nces.ed.gov/datalab/.<br />
42