Garmin GPS 500 - 400/500 (Non-WAAS) Series Display Interfaces (non-Garmin)
Garmin GPS 500 - 400/500 (Non-WAAS) Series Display Interfaces (non-Garmin)
Garmin GPS 500 - 400/500 (Non-WAAS) Series Display Interfaces (non-Garmin)

Create successful ePaper yourself
Turn your PDF publications into a flip-book with our unique Google optimized e-Paper software.
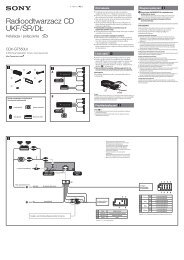
<strong>400</strong>/<strong>500</strong> (NON-<strong>WAAS</strong>)<br />
SERIES DISPLAY<br />
INTERFACES<br />
Pilot’s Guide Addendum<br />
Goodrich STORMSCOPE® WX-<strong>500</strong> <strong>Series</strong> II Weather Mapping Sensor<br />
Goodrich SKYWATCH® Traffic Advisory System (Model SKY497)<br />
Goodrich SKYWATCH® HP Traffic Advisory System (Model SKY899)<br />
Bendix/King® KTA870 TAS/KMH880 Multi-Hazard Awareness System<br />
Ryan TCAD 9900B and 9900BX<br />
190-00140-10_0F.indd 1<br />
3/3/2008 1:14:06 PM
190-00140-10_0F.indd 2<br />
3/3/2008 1:14:06 PM
COPYRIGHT<br />
This Pilot’s Guide Addendum is written for <strong>Garmin</strong> <strong>400</strong>/<strong>500</strong> (<strong>non</strong>-<strong>WAAS</strong>) Main System Software Version 5.03 (<strong>400</strong> <strong>Series</strong>)<br />
and 6.03 (<strong>500</strong> <strong>Series</strong>) or above, and is not applicable for earlier software versions.<br />
© Copyright 2008 <strong>Garmin</strong> Ltd. or its subsidiaries. All Rights Reserved.<br />
<strong>Garmin</strong> International, Inc., 1200 East 151 st Street, Olathe, KS 66062, U.S.A.<br />
Tel. 913/397.8200 or 800/800.1020 Fax 913/397.8282<br />
<strong>Garmin</strong> AT, INC., 2345 Turner Road SE, Salem, OR 97302, U.S.A.<br />
Tel. 503/391.3411 Fax 503/364.2138<br />
<strong>Garmin</strong> (Europe) Ltd., Liberty House, Bulls Copse Road, Hounsdown Business Park, Southampton SO40 9RB, U.K.<br />
Tel. 44/0870.8501241 Fax 44/0870.8501251<br />
<strong>Garmin</strong> Corporation, No. 68, Jangshu 2 nd Road, Shijr, Taipei County, Taiwan<br />
Tel. 886/2.2642.9199 Fax 886/2.2642.9099<br />
Except as expressly provided herein, no part of this addendum may be reproduced, copied, transmitted, disseminated,<br />
downloaded or stored in any storage medium, for any purpose without the express prior written consent of <strong>Garmin</strong>. <strong>Garmin</strong><br />
hereby grants permission to download a single copy of this manual and of any revision to this manual onto a hard drive<br />
or other electronic storage medium to be viewed and to print one copy of this manual or of any revision hereto, provided<br />
that such electronic or printed copy of this manual or revision must contain the complete text of this copyright notice and<br />
provided further that any unauthorized commercial distribution of this manual or any revision hereto is strictly prohibited.<br />
Information in this document is subject to change without notice. <strong>Garmin</strong> reserves the right to change or improve its<br />
products and to make changes in the content without obligation to notify any person or organization of such changes or<br />
improvements.<br />
<strong>Garmin</strong> ® is a registered trademark of <strong>Garmin</strong> Ltd. or its subsidiaries and may not be used without the express<br />
permission of <strong>Garmin</strong> Ltd. or its subsidiaries.<br />
STORMSCOPE ® and SKYWATCH ® are registered trademarks of Goodrich Avionics Systems, Inc.<br />
Bendix/King ® is a registered trademark of Honeywell International, Inc.<br />
March 2008 Part Number 190-00140-10 Rev. F Printed in U.S.A.<br />
190-00140-10 Rev. F<br />
<strong>400</strong>/<strong>500</strong> <strong>Series</strong> <strong>Display</strong> <strong>Interfaces</strong> i<br />
190-00140-10_0F.indd 1<br />
3/3/2008 1:14:06 PM
WARNINGS,<br />
CAUTIONS, & NOTES<br />
CAUTION: The Global Positioning System is operated by the United States government, which is solely<br />
responsible for its accuracy and maintenance. The system is subject to changes which could affect the accuracy<br />
and performance of all <strong>GPS</strong> equipment. Although the <strong>Garmin</strong> <strong>400</strong>/<strong>500</strong> <strong>Series</strong> units are precision electronic<br />
NAVigation AIDS (NAVAID), any NAVAID can be misused or misinterpreted and therefore become unsafe.<br />
CAUTION: Use the <strong>400</strong>/<strong>500</strong> <strong>Series</strong> units at your own risk. To reduce the risk of unsafe operation, carefully<br />
review and understand all aspects of the Owner’s Manual and the Flight Manual Supplement, and thoroughly<br />
practice basic operation prior to actual use. When in actual use, carefully compare indications from the unit<br />
with all available navigation sources, including the information from other NAVAIDS, visual sightings, charts,<br />
etc. For safety, always resolve any discrepancies before continuing navigation.<br />
CAUTION: Use the <strong>Garmin</strong> <strong>400</strong>/<strong>500</strong> <strong>Series</strong> units and the Traffic/Weather Interface at your own risk. To reduce<br />
the risk of unsafe operation, thoroughly practice basic operation prior to actual use. When in actual use, carefully<br />
compare indications from the <strong>Garmin</strong> <strong>Series</strong> Unit with all available navigation sources, including the information<br />
from other NAVAIDS, visual sightings, charts, etc. For safety, always resolve any discrepancies before continuing<br />
navigation. The altitude calculated by the <strong>Garmin</strong> <strong>400</strong> <strong>Series</strong> Unit is the geometric height above mean sea level<br />
and could vary significantly from the altitude displayed by pressure altimeters in the aircraft.<br />
CAUTION: The Jeppesen database incorporated in the <strong>Garmin</strong> <strong>400</strong>/<strong>500</strong> <strong>Series</strong> units must be updated regularly<br />
in order to ensure that its information is current. Updates are released every 28 days. A database information<br />
packet is included in your <strong>Garmin</strong> <strong>400</strong>/<strong>500</strong> <strong>Series</strong> unit package. Pilots using an out-of-date database do so<br />
entirely at their own risk.<br />
CAUTION: The Traffic and Weather information contained in this Pilot’s Guide Addendum is not intended to<br />
replace the documentation that is supplied with the applicable <strong>Garmin</strong> <strong>400</strong>/<strong>500</strong> <strong>Series</strong> unit. The user of the<br />
Traffic and Weather Interface should know how to operate the <strong>400</strong>/<strong>500</strong> unit and be knowledgeable about the<br />
information in the <strong>400</strong>/<strong>500</strong> Pilot’s Guide.<br />
ii<br />
<strong>400</strong>/<strong>500</strong> <strong>Series</strong> <strong>Display</strong> <strong>Interfaces</strong><br />
190-00140-10 Rev. F<br />
190-00140-10_0F.indd 2<br />
3/3/2008 1:14:06 PM
TABLE OF CONTENTS<br />
SECTION 1 INTRODUCTION .................................1-1<br />
SECTION 2 GOODRICH STORMSCOPE<br />
INTERFACE ............................................................2-1<br />
Goodrich STORMSCOPE Description ..........................2-1<br />
Power-Up Self-Test ..................................................... 2-1<br />
User-Initiated Test ....................................................... 2-1<br />
<strong>Display</strong>ing Storm Data on the Map Page .................2-2<br />
Clearing the Map Page ................................................ 2-3<br />
Storm Data <strong>Display</strong> Range ........................................... 2-3<br />
Panning the Map Page ................................................ 2-4<br />
Weather Page ..............................................................2-4<br />
Weather Page—<strong>400</strong> <strong>Series</strong> ......................................... 2-4<br />
Weather Page—<strong>500</strong> <strong>Series</strong> ......................................... 2-5<br />
Weather <strong>Display</strong> .......................................................... 2-5<br />
Weather <strong>Display</strong> Interpretation .................................... 2-6<br />
SECTION 3 SKYWATCH AND BENDIX/KING<br />
INTERFACE ............................................................3-1<br />
Introduction ................................................................ 3-1<br />
SKYWATCH Description ............................................... 3-1<br />
Power-up Self-Test ....................................................... 3-1<br />
User-initiated Test ........................................................ 3-2<br />
Voice Announcements ................................................. 3-2<br />
Switching Between Standby and Operating Modes ....... 3-2<br />
Altitude <strong>Display</strong> Mode ................................................. 3-3<br />
Traffic Page ................................................................. 3-3<br />
Traffic Warning Window ............................................... 3-3<br />
Traffic Page <strong>Display</strong> Range ........................................... 3-4<br />
Configuring Traffic Data on the Map Page .................... 3-4<br />
Highlighting Traffic Data Using Map Panning ............... 3-6<br />
Monitoring Traffic ........................................................ 3-6<br />
Failure Response ......................................................... 3-6<br />
Description of Traffic Advisory Criteria .......................... 3-6<br />
SECTION 4 RYAN TCAD INTERFACE ....................4-1<br />
Differences between the Ryan 9900B TCAD and the Ryan<br />
9900BX TCAD ............................................................. 4-1<br />
Ryan TCAD Description ................................................ 4-1<br />
Operator Controls and Basic <strong>Display</strong>s ........................... 4-1<br />
Configuring TCAD Data on the Map Page .................... 4-2<br />
<strong>Display</strong>ing Thumbnail Traffic onthe Map Page ............... 4-2<br />
Monitoring Traffic ........................................................ 4-3<br />
Highlighting Traffic Data Using Map Panning ............... 4-3<br />
TCAD Setup Page ........................................................ 4-4<br />
Traffic Page Fields ........................................................ 4-4<br />
Air Shield .................................................................... 4-6<br />
Traffic Warning Window ............................................... 4-6<br />
Threat Acquisition ....................................................... 4-6<br />
Audible and Visible Alerts ............................................ 4-6<br />
Fault <strong>Display</strong>s .............................................................. 4-6<br />
Limitations .................................................................. 4-6<br />
190-00140-10 Rev. F<br />
<strong>400</strong>/<strong>500</strong> <strong>Series</strong> <strong>Display</strong> <strong>Interfaces</strong> iii<br />
190-00140-10_0F.indd 3<br />
3/3/2008 1:14:07 PM
TABLE OF CONTENTS<br />
iv<br />
<strong>400</strong>/<strong>500</strong> <strong>Series</strong> <strong>Display</strong> <strong>Interfaces</strong><br />
190-00140-10 Rev. F<br />
190-00140-10_0F.indd 4<br />
3/3/2008 1:14:07 PM
SECTION 1<br />
INTRODUCTION<br />
SECTION 1 INTRODUCTION<br />
The <strong>Garmin</strong> <strong>400</strong>/<strong>500</strong> <strong>Series</strong> units provide the display<br />
interface and control for the following traffic and weather<br />
devices/systems:<br />
• Goodrich STORMSCOPE® WX-<strong>500</strong> <strong>Series</strong> II<br />
Weather Mapping Sensor<br />
• Goodrich SKYWATCH® Traffic Advisory System<br />
(Model SKY497)<br />
• Goodrich SKYWATCH® HP Traffic Advisory<br />
System (Model SKY899)<br />
• Bendix/King® KTA870 TAS/KMH880 Multi-<br />
Hazard Awareness System<br />
• Ryan TCAD 9900B and 9900BX<br />
The interface capability allows traffic and weather data<br />
to be shown on the <strong>400</strong>/<strong>500</strong> color display, which gives<br />
the pilot the ability to quickly identify traffic and weather<br />
hazards relative to the aircraft.<br />
190-00140-10 Rev. F<br />
<strong>400</strong>/<strong>500</strong> <strong>Series</strong> <strong>Display</strong> <strong>Interfaces</strong> 1-1<br />
190-00140-10_0F.indd 1<br />
3/3/2008 1:14:07 PM
SECTION 1<br />
INTRODUCTION<br />
Blank Page<br />
1-2<br />
<strong>400</strong>/<strong>500</strong> <strong>Series</strong> <strong>Display</strong> <strong>Interfaces</strong><br />
190-00140-10 Rev. F<br />
190-00140-10_0F.indd 2<br />
3/3/2008 1:14:07 PM
SECTION 2<br />
STORMSCOPE INTERFACE<br />
SECTION 2 GOODRICH<br />
STORMSCOPE INTERFACE<br />
GOODRICH STORMSCOPE DESCRIPTION<br />
NOTE: The Stormscope is not intended for<br />
hazardous thunderstorm penetration. <strong>Display</strong>ed<br />
weather information is approved for weather<br />
avoidance only. Refer to the WX-<strong>500</strong> User’s<br />
Guide for a detailed description of Stormscope<br />
operation.<br />
The Goodrich STORMSCOPE WX-<strong>500</strong> <strong>Series</strong> II<br />
Weather Mapping Sensor is a passive weather avoidance<br />
system that detects electrical discharges associated with<br />
thunderstorms within a 200-nm radius of the aircraft. The<br />
STORMSCOPE measures relative bearing and distance<br />
of thunderstorm-related electrical activity and reports<br />
the information to the display. <strong>Interfaces</strong> are currently<br />
only available for the WX-<strong>500</strong> <strong>Series</strong> II STORMSCOPE<br />
System.<br />
Power-Up Self-Test<br />
The power-up self-test (Figure 2-1) ensures that the<br />
WX-<strong>500</strong> functions are operating properly. An error<br />
message is displayed on the Message Page if data is no<br />
longer being received.<br />
Figure 2-1 Stormscope Power Up Page<br />
User-Initiated Test<br />
In addition to the power-up test, the WX-<strong>500</strong> performs<br />
a continuous self-test. This continuous self-test is<br />
performed several times per minute. A user-initiated test<br />
can also be performed. The WX-<strong>500</strong> Pilot’s Guide lists all<br />
of the possible faults, probable causes, and recommended<br />
actions if system failures are noted.<br />
Performing a user-initiated test:<br />
1) From the default Nav Page, turn the small right<br />
knob to select the Weather Page.<br />
2) Press the MENU Key to display the Page<br />
Menu.<br />
3) Turn the small right knob to select ‘Self-Test?’<br />
(Figure 2-2).<br />
Figure 2-2 Weather Page Menu<br />
4) Press the ENT Key.<br />
190-00140-10 Rev. F<br />
<strong>400</strong>/<strong>500</strong> <strong>Series</strong> <strong>Display</strong> <strong>Interfaces</strong> 2-1<br />
190-00140-10_0F.indd 1<br />
3/3/2008 1:14:07 PM
SECTION 2<br />
STORMSCOPE INTERFACE<br />
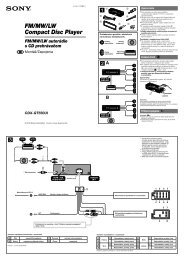
DISPLAYING STORM DATA ON THE MAP PAGE<br />
The Map Page (Figure 2-3) displays cell or strike<br />
information using yellow lightning strike symbology<br />
overlaid on a moving map. This added capability improves<br />
situational awareness, which in turn makes it much easier<br />
for the pilot to relate storm activity to airports, navaids,<br />
obstacles and other ground references.<br />
Storm Activity<br />
Figure 2-3 Storm Data on Map Page<br />
Cell Mode<br />
Strike Rate<br />
NOTE: Storm data is displayed on the Map Page<br />
only if aircraft heading is available.<br />
In normal operation, the current mode and rate are<br />
displayed in the top right-hand corner of the Map Page.<br />
The mode is indicated by the word “STRIKE” when in<br />
strike mode, or “CELL” when in cell mode.<br />
Strike mode indicates the approximate location of<br />
lightning strikes. Only the data that is viewable on the<br />
screen is included in the strike rate.<br />
Cell mode uses a clustering program to identify clusters<br />
of electrical activity that indicate cells. Cell mode is most<br />
useful during periods of heavy storm activity. <strong>Display</strong>ing<br />
cell data during these periods frees the user from sifting<br />
through a screen full of discharge points and helps to<br />
better determine where the storm cells are located.<br />
The strike data display phases are listed below:<br />
• Lightning Symbol (latest strikes; less than one<br />
minute; a black guard band is placed around<br />
the strike symbol during the first six seconds of<br />
display)<br />
• Large Plus “+” sign (more than one minute old)<br />
• Small Plus “+” sign (more than two minutes old)<br />
• Strike Data is no longer displayed (after three<br />
minutes)<br />
Configuring storm data on the Map Page:<br />
1) From the default Nav Page, turn the small right<br />
knob to select the Map Page.<br />
2) Press the MENU Key to display the Page<br />
Menu.<br />
3) Turn the small right knob to select ‘Setup<br />
Map?’.<br />
4) Press the ENT Key, the flashing cursor highlights<br />
the GROUP field.<br />
5) Turn the small right knob to display the Map<br />
Setup Options Menu and select ‘Weather’.<br />
6) Press the ENT Key. The flashing cursor<br />
highlights ‘Weather’ in the GROUP field.<br />
7) Turn the large right knob to select the desired<br />
Weather mode field.<br />
8) Turn the small right knob to select the desired<br />
setting.<br />
9) Press the ENT Key.<br />
10) Repeat steps 7-9 for remaining Weather mode<br />
fields as desired.<br />
11) Press the CLR Key to return to the Map Page.<br />
2-2<br />
<strong>400</strong>/<strong>500</strong> <strong>Series</strong> <strong>Display</strong> <strong>Interfaces</strong><br />
190-00140-10 Rev. F<br />
190-00140-10_0F.indd 2<br />
3/3/2008 1:14:07 PM
SECTION 2<br />
STORMSCOPE INTERFACE<br />
Clearing the Map Page<br />
Routinely clearing the Map Page of all discharge points<br />
is a good way to determine if a storm is building or<br />
dissipating. In a building storm discharge points reappear<br />
faster and in larger numbers. In a dissipating storm<br />
discharge points appear slower and in smaller numbers.<br />
Clearing the Map Page of all discharge<br />
points:<br />
1) From the default Nav Page, turn the small right<br />
knob to select the Map Page.<br />
2) Press the MENU Key to display the Page<br />
Menu.<br />
3) Turn the small right knob to select ‘Clear Storm<br />
Data?’ (Figure 2-4).<br />
Figure 2-4 Map Page Menu<br />
4) Press the ENT Key.<br />
Storm Data <strong>Display</strong> Range<br />
Storm data can be displayed on the 2000 nm zoom<br />
scale, but the data only goes out as far as the STORMSCOPE<br />
can report (200 nm).<br />
North Up Mode: Since the range for Stormscope data<br />
is <strong>400</strong> nm diameter total (200 nm in front and 200 nm<br />
behind), the <strong>500</strong> nm range in North Up mode shows all<br />
the data.<br />
Track Up Mode: In the Track Up mode at the <strong>500</strong><br />
nm range, a portion of Stormscope lightning data can be<br />
behind (“aft” of) the aircraft and therefore not visible on<br />
the Navigation Map.<br />
Selecting a storm data display range:<br />
1) From the default Nav Page, turn the small right<br />
knob to select the Map Page.<br />
2) Press the MENU Key to display the Page Menu.<br />
3) Turn the small right knob to select ‘Setup Map?’.<br />
4) Press the ENT Key.<br />
5) Turn the small right knob to select the Weather<br />
Group.<br />
6) Press the ENT Key.<br />
7) Turn the large right knob to select the desired<br />
lightning symbol option.<br />
8) Turn the small right knob to select the desired<br />
range (Figure 2-5).<br />
9) Press the ENT Key.<br />
Figure 2-5 Range Window<br />
190-00140-10 Rev. F<br />
<strong>400</strong>/<strong>500</strong> <strong>Series</strong> <strong>Display</strong> <strong>Interfaces</strong> 2-3<br />
190-00140-10_0F.indd 3<br />
3/3/2008 1:14:08 PM
SECTION 2<br />
STORMSCOPE INTERFACE<br />
Panning the Map Page<br />
Panning moves the map beyond its current limits<br />
without adjusting the map scale. In panning mode a<br />
target pointer flashes on the map display, and a window<br />
appears at the top of the map display showing the latitude/<br />
longitude position of the pointer. The window also shows<br />
bearing and distance to the pointer from the aircraft’s<br />
present position.<br />
Panning with the cursor on the Map Page allows the<br />
pilot to zoom in and isolate individual cells. Strike data is<br />
not typically updated on the Map Page while the panning<br />
cursor is on, therefore, when the panned map is first<br />
displayed, the data is only a “snapshot” of conditions.<br />
Selecting the panning function and panning<br />
the map display:<br />
1) Press the small right knob to activate the<br />
panning target pointer (Figure 2-6).<br />
2) Turn the small right knob clockwise to move<br />
up, or counterclockwise to move down.<br />
3) Turn the large right knob clockwise to move<br />
right, or counterclockwise to move left.<br />
WEATHER PAGE<br />
Weather Page—<strong>400</strong> <strong>Series</strong><br />
In addition to the Map Page, storm data can also be<br />
viewed on the Weather Page. In the <strong>400</strong> <strong>Series</strong>, when<br />
the STORMSCOPE is connected to the unit, the Weather<br />
Page appears after the Traffic Page in the sequence of NAV<br />
Pages, resulting in a total of nine pages (Figure 2-7).<br />
Default NAV<br />
Weather<br />
(if configured)<br />
Map<br />
TERRAIN<br />
(if configured)<br />
NAV/COM<br />
Position Satellite Status VNAV<br />
Figure 2-7 <strong>400</strong> <strong>Series</strong> NAV Pages<br />
TRAFFIC<br />
(if configured)<br />
Figure 2-6 Panning on Map Page<br />
4) To cancel the panning function and return to<br />
the present position, press the small right<br />
knob.<br />
2-4<br />
<strong>400</strong>/<strong>500</strong> <strong>Series</strong> <strong>Display</strong> <strong>Interfaces</strong><br />
190-00140-10 Rev. F<br />
190-00140-10_0F.indd 4<br />
3/3/2008 1:14:08 PM
SECTION 2<br />
STORMSCOPE INTERFACE<br />
Weather Page—<strong>500</strong> <strong>Series</strong><br />
In addition to the Map Page, storm data can also be<br />
viewed on the Weather Page. In the <strong>500</strong> <strong>Series</strong>, when<br />
the STORMSCOPE is connected to the unit, the Weather<br />
Page appears after the Traffic Page in the sequence of NAV<br />
Pages, resulting in a total of seven pages (Figure 2-8).<br />
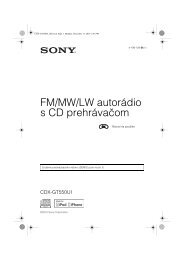
Weather <strong>Display</strong><br />
The Weather Page (Figure 2-9) displays either a 360°<br />
or a 120° viewing angle. In normal operation, the current<br />
strike rate is displayed in the top right-hand corner, and<br />
‘LTNG’ is displayed in the top left-hand corner. When in<br />
strike mode, ‘STRIKE’ is displayed in the lower right-hand<br />
corner of the Weather Page and when the unit is in cell<br />
mode, ‘Cell’ is displayed in the lower right-hand corner of<br />
the Weather Page.<br />
Stormscope Operation<br />
Orientation<br />
Default NAV<br />
Map<br />
Traffic (if configured)<br />
Strike Rate<br />
Storm<br />
Activity<br />
Weather (if configured)<br />
TAWS or TERRAIN<br />
(if configured)<br />
NAV/COM<br />
Weather<br />
Mode<br />
Figure 2-9 Weather Page<br />
Satellite Status<br />
Figure 2-8 <strong>500</strong> <strong>Series</strong> NAV Pages<br />
Selecting the desired Weather <strong>Display</strong><br />
Mode:<br />
1) From the default NAV Page, turn the small<br />
right knob to select the Weather Page.<br />
2) Press the MENU Key to display an options<br />
menu (Figure 2-10).<br />
Figure 2-10 Weather Page Menu<br />
3) Select the desired display angle from the<br />
options menu and press the ENT Key.<br />
190-00140-10 Rev. F<br />
<strong>400</strong>/<strong>500</strong> <strong>Series</strong> <strong>Display</strong> <strong>Interfaces</strong> 2-5<br />
190-00140-10_0F.indd 5<br />
3/3/2008 1:14:09 PM
SECTION 2<br />
STORMSCOPE INTERFACE<br />
Weather <strong>Display</strong> Interpretation<br />
For weather display interpretation, study the examples<br />
in the WX-<strong>500</strong> User’s Guide which are designed to help<br />
relate the cell or strike patterns shown on the display to<br />
the size and location of thunderstorms that may be near<br />
the aircraft.<br />
2-6<br />
<strong>400</strong>/<strong>500</strong> <strong>Series</strong> <strong>Display</strong> <strong>Interfaces</strong><br />
190-00140-10 Rev. F<br />
190-00140-10_0F.indd 6<br />
3/3/2008 1:14:09 PM
SECTION 3<br />
SKYWATCH INTERFACE<br />
SECTION 3 SKYWATCH AND<br />
BENDIX/KING INTERFACE<br />
Introduction<br />
With the exception of traffic display range selections,<br />
all information in this section pertaining to the display<br />
and control of the Goodrich SKYWATCH (SKY 497)<br />
also applies to the Goodrich SKYWATCH HP (SKY 899)<br />
and the Bendix/King KTA 870/KMH 880—this includes<br />
TCAS-like symbology. Traffic display range selections are<br />
as follows:<br />
• SKYWATCH (SKY 497)—2 nm, 2 and 6 nm,<br />
6 and 12 nm.<br />
• SKYWATCH HP (SKY 899)—2 nm, 2 and 6 nm,<br />
6 and 12 nm, 12 and 24 nm.<br />
• Bendix/King KTA 870/KMH 880—2 nm,<br />
2 and 6 nm, 6 and 12 nm, 12 and 24 nm,<br />
20 and 40 nm.<br />
SKYWATCH Description<br />
Please, refer to the SKYWATCH Pilot’s Guide for a<br />
complete description of the SKYWATCH system.<br />
Power-up Self-Test<br />
Check for the following test criteria on the Traffic Page<br />
during power-up:<br />
• If the SKYWATCH passes the power-up test and<br />
the aircraft both has a squat switch and is on the<br />
ground, the Standby Screen is displayed (Figure<br />
3-1).<br />
• If the SKYWATCH passes the power-up test<br />
and the aircraft both has a squat switch and is<br />
airborne, the Traffic Page is displayed on the 6-nm<br />
display range and in the normal altitude display<br />
mode.<br />
• If the SKYWATCH passes the power-up test and<br />
the aircraft does not have a squat switch, the<br />
Standby Screen is displayed (Figure 3-1).<br />
• If the SKYWATCH continues to fail, please refer<br />
to the failure response section in the SKYWATCH<br />
Pilot’s Guide on actions to take.<br />
NOTE: When the system is in standby, the<br />
SKYWATCH does not transmit, interrogate, or<br />
track intruder aircraft.<br />
Figure 3-1 Standby Mode<br />
Tracking intruder aircraft<br />
1) Press the small right knob to activate the<br />
cursor and highlight ‘STBY’.<br />
2) Turn the small right knob to select ‘OPER’.<br />
3) Press the ENT Key to confirm operating mode<br />
and begin tracking intruder aircraft.<br />
NOTE: The FAILED message occurs when the<br />
system detects an error that prohibits further<br />
traffic display operation as long as this message<br />
stays on the screen.<br />
190-00140-10 Rev. F<br />
<strong>400</strong>/<strong>500</strong> <strong>Series</strong> <strong>Display</strong> <strong>Interfaces</strong><br />
3-1<br />
190-00140-10_0F.indd 1<br />
3/3/2008 1:14:09 PM
SECTION 3<br />
SKYWATCH INTERFACE<br />
User-initiated Test<br />
In addition to the power-up test, the SKYWATCH<br />
performs a continuous self-test. This continuous self-test<br />
is performed several times per minute. A user-initiated<br />
test of the SKYWATCH Interface can also be performed.<br />
NOTE: A user-initiated test can only be performed<br />
when in standby or failed mode.<br />
Performing a user-initiated test:<br />
1) Turn the small right knob to select the Traffic<br />
Page.<br />
2) From the Traffic Page, press the MENU Key to<br />
display the Page Menu.<br />
3) Turn the small right knob to select ‘Self<br />
Test?’.<br />
4) Press the ENT Key.<br />
Voice Announcements<br />
See the SKYWATCH Pilot’s Guide for information on<br />
voice announcements.<br />
Switching Between Standby and Operating<br />
Modes<br />
The unit must be in operating mode for traffic to be<br />
displayed. The ability to switch out of standby into operating<br />
mode on the ground is especially useful for scanning the<br />
airspace around the airport before takeoff. Operating Mode<br />
is confirmed by the display of ‘OPER’ in the upper righthand<br />
corner of the Traffic Page (Figure 3-2).<br />
Switching to Operating Mode from Standby<br />
Mode:<br />
1) Press the small right knob to activate the<br />
cursor and highlight ‘STBY’.<br />
2) Turn the small right knob to select ‘OPER?’.<br />
3) Press the ENT Key to confirm and place the<br />
SKYWATCH in operating mode, SKYWATCH<br />
switches out of standby into the 6-nm display<br />
range.<br />
NOTE: If the aircraft has a squat switch and the<br />
pilot does not manually switch out of standby,<br />
the SKYWATCH will automatically switch out of<br />
standby 8 to 10 seconds after takeoff.<br />
Switching to Standby Mode from the Traffic<br />
Page:<br />
1) Press the small right knob to activate the<br />
cursor and highlight ‘OPER’.<br />
2) Turn the small right knob to select ‘STBY?’.<br />
3) Press the ENT Key to confirm and place the<br />
SKYWATCH in standby mode.<br />
NOTE: If the aircraft has a squat switch, STBY is<br />
not displayed while the aircraft is airborne but<br />
will go into standby 24 seconds after landing.<br />
This delay allows the SKYWATCH to remain out<br />
of standby during a touch-and-go maneuver.<br />
3-2<br />
<strong>400</strong>/<strong>500</strong> <strong>Series</strong> <strong>Display</strong> <strong>Interfaces</strong><br />
190-00140-10 Rev. F<br />
190-00140-10_0F.indd 2<br />
3/3/2008 1:14:09 PM
SECTION 3<br />
SKYWATCH INTERFACE<br />
Altitude <strong>Display</strong> Mode<br />
The selected altitude display mode (ABV: look up,<br />
NRM: normal, BLW: look down, or UNR: unrestricted) is<br />
displayed in the upper left-hand corner of the Traffic Page.<br />
The SKY 497 continues to track up to 30 intruder aircraft<br />
within its maximum surveillance range, regardless of the<br />
altitude display mode selected.<br />
Changing the Altitude <strong>Display</strong> Mode:<br />
1) From the Traffic Page, press the small right<br />
knob to activate the cursor and highlight the<br />
current mode (Figure 3-2).<br />
2) Turn the small right knob to cycle through<br />
the options. The screen changes to display<br />
the traffic detected within the selected altitude<br />
display range. The <strong>400</strong> <strong>Series</strong> screen also<br />
displays unrestricted traffic (UNR) having a<br />
maximum range as specified by the SKYWATCH<br />
Pilot’s Guide. Refer to the SKYWATCH Pilot’s<br />
Guide for information regarding altitude<br />
display ranges.<br />
NOTE: Confirmation is not required, the mode is<br />
changed immediately when using the small right<br />
knob.<br />
Traffic Page<br />
Traffic can be displayed both on the Map Page (only<br />
if heading is available) and on the Traffic Page (Figure<br />
3-3). See the <strong>Garmin</strong> <strong>400</strong>/<strong>500</strong> <strong>Series</strong> Installation Manual<br />
available at authorized <strong>Garmin</strong> service centers for details.<br />
Altitude <strong>Display</strong> Mode<br />
Traffic<br />
Figure 3-3 Traffic Page<br />
Traffic Warning Window<br />
Operating Mode<br />
<strong>Display</strong><br />
Range<br />
Traffic Advisory<br />
(with no bearing<br />
information)<br />
When the unit is not on the traffic page and a traffic<br />
threat is imminent, the Traffic Warning Window (Figure<br />
3-4) is displayed,.which shows a small thumbnail map.<br />
When the Traffic Warning Window is displayed, press the<br />
ENT Key to display the Traffic Page, or press the CLR Key<br />
to return to the previous page.<br />
NOTE: The Traffic Warning Window is disabled<br />
when the aircraft ground speed is less than 30<br />
knots or when an approach is active.<br />
Figure 3-2 “UNR” Selected<br />
3) Press the small right knob to turn the cursor<br />
off after the selection is made.<br />
Figure 3-4 Traffic Warning Window<br />
190-00140-10 Rev. F<br />
<strong>400</strong>/<strong>500</strong> <strong>Series</strong> <strong>Display</strong> <strong>Interfaces</strong><br />
3-3<br />
190-00140-10_0F.indd 3<br />
3/3/2008 1:14:09 PM
SECTION 3<br />
SKYWATCH INTERFACE<br />
Traffic Page <strong>Display</strong> Range<br />
6) Press the ENT Key (Figure 3-5).<br />
The display range on the Traffic Page can be changed<br />
at any time.<br />
Changing the display range on the Traffic<br />
Page:<br />
Press the RNG Key to zoom through the following<br />
range options:<br />
• 2 nm<br />
• 2 and 6 nm<br />
• 6 and 12 nm<br />
• 12 and 24 nm for the SKY 899 only<br />
Configuring Traffic Data on the Map Page<br />
The display of traffic information is designed to closely<br />
resemble the display symbology used by Goodrich on the<br />
SKYWATCH.<br />
Traffic is only displayed on the Map Page if aircraft<br />
heading data is available. When heading is not available,<br />
Traffic Advisories are displayed as <strong>non</strong>-bearing banners on<br />
the Map Page. See the <strong>Garmin</strong> <strong>400</strong>/<strong>500</strong> <strong>Series</strong> Installation<br />
Manual available at authorized <strong>Garmin</strong> service centers for<br />
details.<br />
Configuring traffic on the Map Page:<br />
1) Turn the small right knob to select the Map<br />
Page.<br />
2) Press the MENU Key to display the Page<br />
Menu.<br />
3) Turn the small right knob to select ‘Setup<br />
Map?’.<br />
4) Press the ENT Key. The flashing cursor<br />
highlights the GROUP field.<br />
5) Turn the small right knob to select ‘Traffic’.<br />
Figure 3-5 Map Setup Menu<br />
7) Turn the large right knob to select the desired<br />
Traffic Mode option.<br />
8) Turn the small right knob to select the desired<br />
option<br />
9) Press the ENT Key. Repeat steps 7-9 for Traffic<br />
Symbol and Traffic Label.<br />
10) Return to the Map Page by pressing the CLR<br />
Key.<br />
Traffic mode allows the operator to choose which traffic<br />
is displayed (all traffic, traffic and proximity advisories,<br />
or traffic advisories only). The traffic symbol (Table 3-1)<br />
is used to depict the type of traffic (<strong>400</strong>/<strong>500</strong> <strong>Series</strong> and<br />
Goodrich use the same symbology):<br />
Type of Traffic<br />
Traffic Advisories (TA)<br />
Proximity Advisories (PA)<br />
Other<br />
Table 3-1<br />
Symbol<br />
3-4<br />
<strong>400</strong>/<strong>500</strong> <strong>Series</strong> <strong>Display</strong> <strong>Interfaces</strong><br />
190-00140-10 Rev. F<br />
190-00140-10_0F.indd 4<br />
3/3/2008 1:14:10 PM
SECTION 3<br />
SKYWATCH INTERFACE<br />
NOTE: Proximity Advisories (PA) are displayed as<br />
solid white diamonds. SKYWATCH shows these<br />
PAs as hollow diamonds since the SKYWATCH<br />
display is monochrome. PAs are defined as traffic<br />
within the 4.0-nm range, within ± 1200 ft. of<br />
altitude separation, and are not a traffic advisory<br />
(TA).<br />
The traffic label is the altitude separation above or<br />
below the symbol and the vertical speed sense arrow to<br />
the right of the symbol (Figure 3-6).<br />
Figure 3-6 Traffic Label<br />
<strong>Display</strong>ing Thumbnail Traffic on the Map<br />
Page<br />
1) Turn the small right knob to select the Map<br />
Page.<br />
2) Press the MENU Key to display the Page<br />
Menu.<br />
3) Turn the small right knob to select ‘Change<br />
Fields?’.<br />
4) Press the ENT Key.<br />
5) Turn the large right knob to select one of the<br />
top three fields (top four fields on the <strong>500</strong><br />
<strong>Series</strong>).<br />
6) Turn the small right knob to select ‘TRFC’ from<br />
the Select Field Type List.<br />
7) Press the ENT Key. (Figure 3-8)<br />
From the Map Page, traffic in a thumbnail format can<br />
be displayed in any of the top three data fields (top four<br />
fields on the <strong>500</strong> <strong>Series</strong>) on the right side of the Map Page<br />
(Figure 3-8).<br />
When a Traffic Advisory is active, the “Traffic” banner<br />
is displayed in the lower right corner of the Map Page<br />
(Figure 3-7)<br />
Figure 3-8 Thumbnail Traffic on Map Page<br />
NOTE: The thumbnail range defaults to 6 nm and<br />
cannot be changed.<br />
Figure 3-7 Traffic Banner<br />
190-00140-10 Rev. F<br />
<strong>400</strong>/<strong>500</strong> <strong>Series</strong> <strong>Display</strong> <strong>Interfaces</strong><br />
3-5<br />
190-00140-10_0F.indd 5<br />
3/3/2008 1:14:10 PM
SECTION 3<br />
SKYWATCH INTERFACE<br />
Highlighting Traffic Data Using Map Panning<br />
Another map page function is panning, which allows<br />
changing the map beyond its current limits without<br />
adjusting the map scale. Select the panning function by<br />
pressing the small right knob, a target pointer flashes on<br />
the map display (Figure 3-9). Also a window appears at<br />
the top of the map display showing the latitude/longitude<br />
position of the pointer, and the bearing and distance to<br />
the pointer from the present position.<br />
Selecting the panning function and panning<br />
the map display:<br />
1) Press the small right knob to activate the<br />
panning target pointer (Figure 3-9).<br />
When the target pointer is placed on traffic, the traffic<br />
range and altitude separation are displayed. The traffic is<br />
identified as:<br />
• TA: Traffic Advisory<br />
• PA: Proximity Advisory<br />
• TRFC: Other Traffic<br />
Monitoring Traffic<br />
Refer to the SKYWATCH Pilot’s Guide for information<br />
regarding monitoring traffic on the display and the<br />
corresponding actions to take.<br />
Failure Response<br />
Errors indicated by a FAILED screen prevent continued<br />
use of the SKYWATCH. See the Goodrich SKYWATCH<br />
Pilot’s Guide for detailed information on Failure<br />
Response.<br />
Description of Traffic Advisory Criteria<br />
For a description of Traffic Advisory criteria and display<br />
interpretation, refer to the SKYWATCH Pilot’s Guide.<br />
Figure 3-9 Panning the Map <strong>Display</strong><br />
2) Turn the small right knob clockwise to move<br />
up, or counterclockwise to move down.<br />
3) Turn the large right knob clockwise to move<br />
right, or counterclockwise to move left.<br />
4) To cancel the panning function and return to<br />
the present position, press the small right<br />
knob.<br />
3-6<br />
<strong>400</strong>/<strong>500</strong> <strong>Series</strong> <strong>Display</strong> <strong>Interfaces</strong><br />
190-00140-10 Rev. F<br />
190-00140-10_0F.indd 6<br />
3/3/2008 1:14:10 PM
SECTION 4<br />
RYAN TCAD INTERFACE<br />
SECTION 4 RYAN TCAD INTERFACE<br />
Differences between the Ryan 9900B TCAD and<br />
the Ryan 9900BX TCAD<br />
All information in this section pertaining to the display<br />
and control of the Ryan 9900B TCAD also applies to the<br />
Ryan 9900BX TCAD except for the following:<br />
• TCAS-like symbology is used in the 9900BX as<br />
opposed to the 9900B (similar to SKYWATCH).<br />
• Altitude modes are available similar to<br />
SKYWATCH (normal, look up, look down,<br />
unrestricted).<br />
• Ranges are manually controlled instead of being<br />
automatically re-sized to the current shield.<br />
• Traffic display range selections are different:<br />
• Ryan 9900B—range is slaved to current shield<br />
size.<br />
• Ryan 9900BX—2 nm, 2 and 6 nm, 6 and 12 nm,<br />
12 and 24 nm.<br />
Ryan TCAD Description<br />
NOTE: Refer to the Ryan TCAD Pilot’s Guide for a<br />
detailed description of the Ryan TCAD System.<br />
The Ryan TCAD (Traffic and Collision Alert Device) is<br />
an on-board air traffic display used to identify potential<br />
collision threats. TCAD computes relative altitude<br />
and range of threats from nearby Mode C and Mode<br />
S-equipped aircraft. TCAD will not detect aircraft without<br />
operating transponders or those that are beyond radar<br />
coverage. TCAD, within defined limits, creates a shield<br />
of airspace around the aircraft, whereby detected traffic<br />
cannot penetrate without triggering an alert.<br />
190-00140-10 Rev. F<br />
Operator Controls and Basic <strong>Display</strong>s<br />
If there is no communication between the display unit<br />
and the TCAD unit, a message will appear, notifying the<br />
user. After initialization, proceed with operation of the<br />
<strong>400</strong>/<strong>500</strong> <strong>Series</strong> unit in a normal manner.<br />
TCAD data can be shown in a “thumbnail” view on the<br />
Map Page. TCAD data also displays on both the Traffic<br />
Page (Figure 4-1) and the Map Page if heading data is<br />
available.<br />
Figure 4-1 Traffic Page<br />
The symbols for closing and parting traffic shown on<br />
both the Map Page and the Traffic Page are identical to<br />
those shown on the Ryan TCAD (see Ryan TCAD Pilot’s<br />
Guide for detailed decscription):<br />
Symbol Name Description<br />
TRFC Altitude separation ><strong>500</strong> feet, steady<br />
altitude separation<br />
TA Altitude separation <strong>500</strong> feet, closing<br />
PA<br />
TRFC<br />
TA<br />
Altitude separation <strong>500</strong> feet, parting<br />
Altitude separation
SECTION 4<br />
RYAN TCAD INTERFACE<br />
Configuring TCAD Data on the Map Page<br />
The display of traffic information closely resembles the<br />
display symbology used by the Ryan TCAD. Traffic data<br />
is only displayed on the Map Page if heading data is<br />
available.<br />
Configuring Traffic on the Map Page:<br />
1) Turn the small right knob to select the Map<br />
Page.<br />
2) Press the MENU Key to display the Page<br />
Menu.<br />
3) Use the small right knob to select ‘Setup<br />
Map?’<br />
4) Press the ENT Key. The flashing cursor<br />
highlights the GROUP field.<br />
5) Turn the small right knob to select ‘Traffic’<br />
(Figure 4-2).<br />
<strong>Display</strong>ing Thumbnail Traffic onthe Map Page<br />
The Map Page has the ability to display traffic in a<br />
thumbnail format in any of the top three fields (top four<br />
fields on a <strong>500</strong> <strong>Series</strong> unit) on the right-hand side of the<br />
Map Page.<br />
To display Thumbnail Traffic on the Map<br />
Page:<br />
1) Turn the small right knob to select the Map<br />
Page.<br />
2) Press the MENU Key to display the Page<br />
Menu.<br />
3) Use the small right knob to select ‘Change<br />
Fields?’ (Figure 4-3).<br />
Figure 4-3 Map Page Menu<br />
Figure 4-2 Map Setup Options Menu<br />
7) Press the ENT Key.<br />
8) Turn the large right knob to select the desired<br />
Traffic Mode option.<br />
9) Turn the small right knob to select the desired<br />
option.<br />
10) Press the ENT Key. Repeat steps 8-10 for Traffic<br />
Symbol and Traffic Label.<br />
11) Press the CLR Key to return to the Map Page.<br />
4) Press the ENT Key.<br />
5) Turn the large right knob to select one of the<br />
top three fields (top four fields on a <strong>500</strong> <strong>Series</strong><br />
unit).<br />
6) Select ‘TRFC’ from the Select Field Type List.<br />
7) Press the ENT Key.<br />
NOTE: The thumbnail range defaults to 6 nm and<br />
cannot be changed.<br />
4-2<br />
<strong>400</strong>/<strong>500</strong> <strong>Series</strong> <strong>Display</strong> <strong>Interfaces</strong><br />
190-00140-10 Rev. F<br />
190-00140-10_0F.indd 2<br />
3/3/2008 1:14:11 PM
SECTION 4<br />
RYAN TCAD INTERFACE<br />
Monitoring Traffic<br />
Refer to the information in the TCAD Pilot’s Guide<br />
regarding monitoring traffic on the display and the<br />
corresponding actions to take.<br />
Highlighting Traffic Data Using Map Panning<br />
Panning is another map page function, which allows<br />
moving the map beyond its current limits without<br />
adjusting the map scale. Select the panning function—by<br />
pressing the small right knob—a target pointer flashes on<br />
the map display. Also a window also appears at the top of<br />
the map display showing the latitude/longitude position<br />
of the pointer, and the bearing and distance to the pointer<br />
from the present position.<br />
When the target pointer is placed on traffic, the traffic<br />
range, altitude separation, squawk code (if available), and<br />
tail number (if available) are displayed (Figure 4-4).<br />
Panning the map:<br />
1) Press the small right knob to activate the<br />
panning target pointer (Figure 4-4).<br />
Figure 4-4 Panning the Map Page<br />
2) Turn the small right knob to move up (turn<br />
clockwise), or down (turn counterclockwise).<br />
3) Turn the large right knob to move right (turn<br />
clockwise), or left (turn counterclockwise)<br />
4) Press the small right knob to cancel map<br />
panning and return to the present position, .<br />
The traffic is identified as follows:<br />
• TA: Traffic Advisory—This is traffic within <strong>500</strong><br />
ft. of altitude separation that is converging or<br />
maintaining altitude separation.<br />
• PA: Proximity Advisory—This is traffic within <strong>500</strong><br />
ft. of separation and it is not a TA.<br />
• TRFC:—Other traffic<br />
190-00140-10 Rev. F<br />
<strong>400</strong>/<strong>500</strong> <strong>Series</strong> <strong>Display</strong> <strong>Interfaces</strong> 4-3<br />
190-00140-10_0F.indd 3<br />
3/3/2008 1:14:11 PM
SECTION 4<br />
RYAN TCAD INTERFACE<br />
TCAD Setup Page<br />
The Ryan TCAD Setup Page is accessed from the Traffic<br />
Page. The TCAD Setup Page allows traffic data to be<br />
configured. The definitions of the available options are<br />
listed in the TCAD Pilot’s Handbook.<br />
Changing a TCAD setup option:<br />
1) Turn the small right knob to select the Traffic<br />
Page.<br />
2) Press the MENU Key to display the Page<br />
Menu.<br />
3) Turn the small right knob to select ‘Setup?’.<br />
4) Press the ENT Key. The flashing cursor<br />
highlights the Mode field (Figure 4-5).<br />
Traffic Page Fields<br />
There are two selectable fields on the Traffic Page:<br />
the Operating Mode Field and the Barometric Pressure<br />
Field. The Operating Mode Field selects the TCAD<br />
operating mode (Table 4-2). Please, refer to the TCAD<br />
Pilot’s Handbook for a complete description of all modes<br />
of operation. For the 9900BX model, this field is replaced<br />
with the SKYWATCH style altitude mode.<br />
TCAD 9900B Operating Modes<br />
GND<br />
Ground Mode<br />
TML<br />
Terminal Mode<br />
STD<br />
Standard Mode<br />
ENR<br />
Enroute Mode<br />
UNR<br />
Unrestricted Mode<br />
Table 4-2<br />
NOTE: The modes APR (approach) and DEP<br />
(departure), are displayed when in either of those<br />
modes, but are not manually selectable.<br />
Figure 4-5 Ryan TCAD Setup Page<br />
5) Turn the small right knob to select the desired<br />
mode. The mode selection determines which<br />
shield definition to display and change.<br />
6) Press the ENT Key.<br />
7) Select the desired remaining options fields<br />
by turning the large right knob, then turn<br />
the small right knob to select the desired<br />
option, and press the ENT Key to confirm the<br />
selection.<br />
8) Return to the Traffic Page by pressing the CLR<br />
Key.<br />
4-4<br />
<strong>400</strong>/<strong>500</strong> <strong>Series</strong> <strong>Display</strong> <strong>Interfaces</strong><br />
190-00140-10 Rev. F<br />
190-00140-10_0F.indd 4<br />
3/3/2008 1:14:11 PM
SECTION 4<br />
RYAN TCAD INTERFACE<br />
To select the Operating Mode:<br />
1) From the Traffic Page, press the small right<br />
knob to activate the cursor, the operating mode<br />
field is highlighted.<br />
2 Turn the small right knob to select the desired<br />
operating mode.<br />
3) Press the ENT Key.<br />
NOTE: The traffic display range is automatically<br />
set to the shield size and cannot be changed<br />
(9900B only).<br />
The second selectable field, located in the upper righthand<br />
corner of the display, is the Barometric Pressure<br />
field, which displays the Barometric Pressure in inches of<br />
mercury. The Barometric Pressure field on the Traffic Page<br />
is used to set the barometric pressure in the Ryan TCAD<br />
unit. Please, refer to the TCAD Pilot’s Handbook for a<br />
detailed description of this feature.<br />
Changing the Barometric Pressure:<br />
1) From the Traffic Page, press the small right<br />
knob to activate the cursor and highlight the<br />
Operating Mode field.<br />
2) Turn the large right knob to select the<br />
Barometric Pressure Field.<br />
3) Use the small right knob to select the desired<br />
value (Figure 4-6). When editing the value,<br />
use the large right knob to select the digit to<br />
edit.<br />
Figure 4-6 Barometric Pressure Selected<br />
4) Press the ENT Key.<br />
5) Press the small right knob to exit the field.<br />
When the TCAD 9900BX model is interfaced there is<br />
an additional annunciation in the lower left-hand corner<br />
of the Traffic Page. This indicates the TCAD unit being in<br />
approach mode (APR) or if the approach is armed (APR<br />
ARM).<br />
190-00140-10 Rev. F<br />
<strong>400</strong>/<strong>500</strong> <strong>Series</strong> <strong>Display</strong> <strong>Interfaces</strong> 4-5<br />
190-00140-10_0F.indd 5<br />
3/3/2008 1:14:11 PM
SECTION 4<br />
RYAN TCAD INTERFACE<br />
Air Shield<br />
Refer to the TCAD Pilot’s Handbook for a detailed<br />
description of the Air Shield.<br />
Traffic Warning Window<br />
When the unit is not on the traffic page and a traffic<br />
threat is imminent, the Traffic Warning Window (Figure<br />
4-7) is displayed. The Warning Window shows a small<br />
thumbnail map and can display the Traffic Page (press the<br />
ENT Key) or return to the previous page (press the CLR<br />
Key).<br />
NOTE: The Traffic Warning Window is disabled<br />
when the aircraft ground speed is less than 30<br />
knots or when an approach is active.<br />
Threat Acquisition<br />
Refer to the TCAD Pilot’s Handbook for a detailed<br />
description of the Air Shield.<br />
Audible and Visible Alerts<br />
Voice and tones are used to alert the pilot. The alert<br />
descriptions used by TCAD are listed in the TCAD Pilot’s<br />
Handbook. Voice is used only during the highest level<br />
of alerting; otherwise, tone is used. The voice alerting<br />
can be turned on or off from the TCAD Setup Page or<br />
from the configuration pages. See the <strong>Garmin</strong> <strong>400</strong>/<strong>500</strong><br />
<strong>Series</strong> Installation Manual available at authorized <strong>Garmin</strong><br />
Service Centers (only for the 9900 model).<br />
Fault <strong>Display</strong>s<br />
If the unit fails to detect the TCAD or if the TCAD data<br />
that is received is invalid, the traffic screen shows “DATA<br />
FAIL”.<br />
Limitations<br />
Refer to the TCAD Pilot’s Handbook for limitations of<br />
the TCAD system.<br />
Figure 4-7 Traffic Warning Window<br />
4-6<br />
<strong>400</strong>/<strong>500</strong> <strong>Series</strong> <strong>Display</strong> <strong>Interfaces</strong><br />
190-00140-10 Rev. F<br />
190-00140-10_0F.indd 6<br />
3/3/2008 1:14:11 PM
190-00140-10_0F.indd 7<br />
3/3/2008 1:14:11 PM
<strong>Garmin</strong> International, Inc.<br />
1200 East 151st Street<br />
Olathe, KS 66062, U.S.A.<br />
p: 913.397.8200 f: 913.397.8282<br />
<strong>Garmin</strong> AT, Inc.<br />
2345 Turner Road SE<br />
Salem, OR 97302, U.S.A.<br />
p: 503.391.3411 f: 503.364.2138<br />
<strong>Garmin</strong> (Europe) Ltd.<br />
Liberty House, Bulls Copse Road<br />
Hounsdown Business Park<br />
Southampton, SO40 9RB, U.K.<br />
p: 44/ (0) 870.8501241 f: 44/ (0) 870.8501251<br />
<strong>Garmin</strong> Corporation<br />
No. 68, Jangshu 2nd Road<br />
Shijr, Taipei County, Taiwan<br />
p: 886/2.2642.9199 f: 886/2.2642.9099<br />
www.garmin.com<br />
© 2008 <strong>Garmin</strong> Ltd. or its subsidiaries<br />
190-00140-10 Rev. F<br />
190-00140-10_0F.indd 8<br />
3/3/2008 1:14:14 PM