


Create successful ePaper yourself
Turn your PDF publications into a flip-book with our unique Google optimized e-Paper software.
[SECTION] 1 = INTERNET PENETRATION<br />
1.1 Unique IPv4 Addresses / The number of unique IPv4 addresses<br />
worldwide connecting to Akamai decreased by about 1.8 million in<br />
the first quarter of 2016. This is in line with our expectation that<br />
the number of unique global IPv4 addresses seen by Akamai may<br />
continue to level off or decline modestly in the future as carriers<br />
increase the availability of native IPv6 connectivity for subscribers<br />
and implement Carrier-Grade Network Address Translation<br />
(cgnat) solutions more broadly in an effort to conserve limited<br />
IPv4 address space.<br />
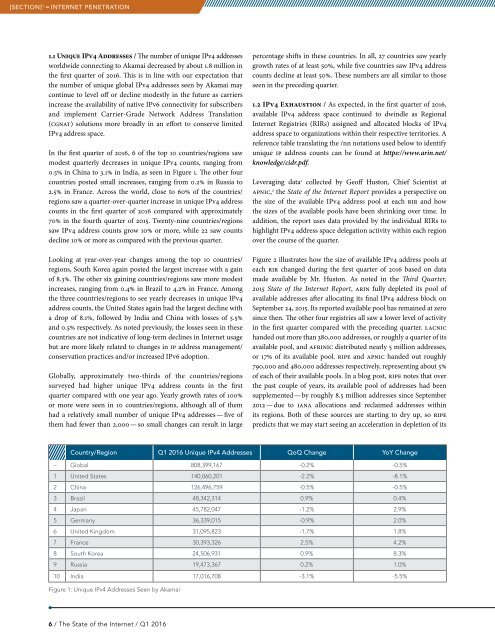
In the first quarter of 2016, 6 of the top 10 countries/regions saw<br />
modest quarterly decreases in unique IPv4 counts, ranging from<br />
0.5% in China to 3.1% in India, as seen in Figure 1. The other four<br />
countries posted small increases, ranging from 0.2% in Russia to<br />
2.5% in France. Across the world, close to 60% of the countries/<br />
regions saw a quarter-over-quarter increase in unique IPv4 address<br />
counts in the first quarter of 2016 compared with approximately<br />
70% in the fourth quarter of 2015. Twenty-nine countries/regions<br />
saw IPv4 address counts grow 10% or more, while 22 saw counts<br />
decline 10% or more as compared with the previous quarter.<br />
Looking at year-over-year changes among the top 10 countries/<br />
regions, South Korea again posted the largest increase with a gain<br />
of 8.3%. The other six gaining countries/regions saw more modest<br />
increases, ranging from 0.4% in Brazil to 4.2% in France. Among<br />
the three countries/regions to see yearly decreases in unique IPv4<br />
address counts, the United States again had the largest decline with<br />
a drop of 8.1%, followed by India and China with losses of 5.5%<br />
and 0.5% respectively. As noted previously, the losses seen in these<br />
countries are not indicative of long-term declines in Internet usage<br />
but are more likely related to changes in ip address management/<br />
conservation practices and/or increased IPv6 adoption.<br />
Globally, approximately two-thirds of the countries/regions<br />
surveyed had higher unique IPv4 address counts in the first<br />
quarter compared with one year ago. Yearly growth rates of 100%<br />
or more were seen in 10 countries/regions, although all of them<br />
had a relatively small number of unique IPv4 addresses — five of<br />
them had fewer than 2,000 — so small changes can result in large<br />
percentage shifts in these countries. In all, 27 countries saw yearly<br />
growth rates of at least 50%, while five countries saw IPv4 address<br />
counts decline at least 50%. These numbers are all similar to those<br />
seen in the preceding quarter.<br />
1.2 IPv4 Exhaustion / As expected, in the first quarter of 2016,<br />
available IPv4 address space continued to dwindle as Regional<br />
Internet Registries (RIRs) assigned and allocated blocks of IPv4<br />
address space to organizations within their respective territories. A<br />
reference table translating the /nn notations used below to identify<br />
unique ip address counts can be found at https://www.arin.net/<br />
knowledge/cidr.pdf.<br />
Leveraging data 1 collected by Geoff Huston, Chief Scientist at<br />
apnic, 2 the State of the Internet Report provides a perspective on<br />
the size of the available IPv4 address pool at each rir and how<br />
the sizes of the available pools have been shrinking over time. In<br />
addition, the report uses data provided by the individual RIRs to<br />
highlight IPv4 address space delegation activity within each region<br />
over the course of the quarter.<br />
Figure 2 illustrates how the size of available IPv4 address pools at<br />
each rir changed during the first quarter of 2016 based on data<br />
made available by Mr. Huston. As noted in the Third Quarter,<br />
2015 State of the Internet Report, arin fully depleted its pool of<br />
available addresses after allocating its final IPv4 address block on<br />
September 24, 2015. Its reported available pool has remained at zero<br />
since then. The other four registries all saw a lower level of activity<br />
in the first quarter compared with the preceding quarter. lacnic<br />
handed out more than 380,000 addresses, or roughly a quarter of its<br />
available pool, and afrinic distributed nearly 5 million addresses,<br />
or 17% of its available pool. ripe and apnic handed out roughly<br />
790,000 and 480,000 addresses respectively, representing about 5%<br />
of each of their available pools. In a blog post, ripe notes that over<br />
the past couple of years, its available pool of addresses had been<br />
supplemented — by roughly 8.5 million addresses since September<br />
2012 — due to iana allocations and reclaimed addresses within<br />
its regions. Both of these sources are starting to dry up, so ripe<br />
predicts that we may start seeing an acceleration in depletion of its<br />
Country/Region Q1 2016 Unique IPv4 Addresses QoQ Change YoY Change<br />
– Global 808,399,167 -0.2% -0.5%<br />
1 United States 140,060,201 -2.2% -8.1%<br />
2 China 126,496,759 -0.5% -0.5%<br />
3 Brazil 48,342,314 0.9% 0.4%<br />
4 Japan 45,782,047 -1.2% 2.9%<br />
5 Germany 36,339,015 -0.9% 2.0%<br />
6 United Kingdom 31,095,823 -1.7% 1.8%<br />
7 France 30,393,326 2.5% 4.2%<br />
8 South Korea 24,506,931 0.9% 8.3%<br />
9 Russia 19,473,367 0.2% 1.0%<br />
10 India 17,016,708 -3.1% -5.5%<br />
Figure 1: Unique IPv4 Addresses Seen by Akamai<br />
6 / The State of the Internet / Q1 2016