- Page 1 and 2:
SAP HANA Platform SPS 12 Document V
- Page 3 and 4:
Naive Bayes. ......................
- Page 5 and 6:
1 What is PAL? SAP HANA’s SQLScri
- Page 7 and 8:
2 Getting Started with PAL This sec
- Page 9 and 10:
The result will tell you whether th
- Page 11 and 12:
● : The name of the schema where
- Page 13 and 14:
CREATE COLUMN TABLE PAL_ARIMAX_DATA
- Page 15 and 16:
For more information on how to use
- Page 17 and 18:
Category PAL Algorithm Built-in Fun
- Page 19 and 20:
Category PAL Algorithm Built-in Fun
- Page 21 and 22:
The procedure name is the same as s
- Page 23 and 24:
● USER1 has been assigned the AFL
- Page 25 and 26:
3.1.2 Agglomerate Hierarchical Clus
- Page 27 and 28:
Table 13: Name Data Type Default Va
- Page 29 and 30:
Name Data Type Default Value Descri
- Page 31 and 32:
INSERT INTO DATA_TBL VALUES ('17',
- Page 33 and 34:
Prerequisites ● ● The input dat
- Page 35 and 36:
Name Data Type Default Value Descri
- Page 37 and 38:
INSERT INTO PAL_AD_DATA_TBL VALUES
- Page 39 and 40:
The signature table should contain
- Page 41 and 42:
CREATE TYPE PAL_KMEANS_CENTERS_T AS
- Page 43 and 44:
PAL_CLUSTER_ASSIGNED_TBL: For DBSCA
- Page 45 and 46:
For SOM: SET SCHEMA DM_PAL; DROP TY
- Page 47 and 48:
PAL_CLUSTER_ASSIGNED_TBL: Related I
- Page 49 and 50:
Table 24: Name Data Type Descriptio
- Page 51 and 52:
DROP TYPE PAL_CONTROL_T; CREATE TYP
- Page 53 and 54:
3.1.6 Gaussian Mixture Model (GMM)
- Page 55 and 56:
Table 29: Name Data Type Descriptio
- Page 57 and 58:
Output Tables Output format 0: Tabl
- Page 59 and 60:
INSERT INTO PAL_GMM_PDATA_TBL VALUE
- Page 61 and 62:
Example 2 SET SCHEMA DM_PAL; DROP T
- Page 63 and 64:
PAL_GMM_RESULTSMODEL_TBL: 3.1.7 K-M
- Page 65 and 66:
The signature table should contain
- Page 67 and 68:
Name Data Type Default Value Descri
- Page 69 and 70:
Table 43: Table Column Column Data
- Page 71 and 72:
INSERT INTO #PAL_CONTROL_TBL VALUES
- Page 73 and 74:
PAL_KMEANS_MODEL_TBL: VALIDATEKMEAN
- Page 75 and 76:
"V000" DOUBLE, "A0" INTEGER, "A1" I
- Page 77 and 78:
Expected Result PAL_SILHOUETTE_RESU
- Page 79 and 80:
Table Column Column Data Type Descr
- Page 81 and 82:
Example Assume that: ● ● ● DM
- Page 83 and 84:
PAL_KMEDIANS_ASSIGN_TBL: 3.1.9 K-Me
- Page 85 and 86:
Position Schema Name Table Type Nam
- Page 87 and 88:
Name Data Type Default Value Descri
- Page 89 and 90:
INSERT INTO #PAL_CONTROL_TBL VALUES
- Page 91 and 92:
The input, parameter, and output ta
- Page 93 and 94:
Table 67: Table Column Column Data
- Page 95 and 96:
INSERT INTO PARAMETERS_TBL VALUES (
- Page 97 and 98:
DOCTOPICDIST_TBL: GENERALINFO_TBL:
- Page 99 and 100:
Procedure Calling CALL .(, , ) with
- Page 101 and 102:
Name Data Type Default Value Descri
- Page 103 and 104:
Expected Result DOCTOPICDIST_TBL: 3
- Page 105 and 106:
The following parameters are option
- Page 107 and 108:
Table Column Column Data Type Descr
- Page 109 and 110:
INSERT INTO #PAL_CONTROL_TBL VALUES
- Page 111 and 112:
CREATE TYPE PAL_SOM_MODEL_T AS TABL
- Page 113 and 114:
PAL_SOM_RESASSIGN_TBL: PAL_SOM_MODE
- Page 115 and 116:
Table 78: Table Column Column Data
- Page 117 and 118:
INSERT INTO PAL_SLIGHT_SIL_PDATA_TB
- Page 119 and 120:
AUC Procedure Generation CALL SYS.A
- Page 121 and 122:
Table 85: Name Data Type Default Va
- Page 123 and 124:
Example 2 SET SCHEMA DM_PAL; DROP T
- Page 125 and 126:
3.2.2 Back Propagation Neural Netwo
- Page 127 and 128:
CREATEBPNN This function trains a B
- Page 129 and 130:
Name Data Type Default Value Descri
- Page 131 and 132:
INSERT INTO PAL_TRAIN_NN_DATA_TBL V
- Page 133 and 134:
PAL_TRAIN_NN_RESULT_TBL: PAL_REGRES
- Page 135 and 136:
Classification example: SET SCHEMA
- Page 137 and 138:
"NAME" VARCHAR(100), "MODEL" CLOB )
- Page 139 and 140:
The signature table should contain
- Page 141 and 142:
Name Data Type Default Value Descri
- Page 143 and 144:
CREATE TYPE PAL_C45_DATA_T AS TABLE
- Page 145 and 146:
CART This function is used for clas
- Page 147 and 148:
Name Data Type Default Value Descri
- Page 149 and 150:
Table Column Column Data Type Descr
- Page 151 and 152:
Prerequisites ● ● The target co
- Page 153 and 154:
Name Data Type Default Value Descri
- Page 155 and 156:
Name Data Type Default Value Descri
- Page 157 and 158:
PAL_CHAID_TREEMODEL_TBL: PAL_CHAID_
- Page 159 and 160:
Table Column Column Data Type Descr
- Page 161 and 162:
INSERT INTO PAL_CM_DATA_TBL VALUES(
- Page 163 and 164:
The following parameters are option
- Page 165 and 166:
PAL_KNN_RESULTS_TBL: 3.2.8 Logistic
- Page 167 and 168:
Procedure Calling CALL .(, , , , )
- Page 169 and 170:
Name Data Type Default Value Descri
- Page 171 and 172:
Table Column Column Data Type Descr
- Page 173 and 174:
PAL_LOGISTICR_STAT_TBL: PAL_LOGISTI
- Page 175 and 176:
Procedure Generation CALL SYS.AFLLA
- Page 177 and 178:
Assume that: ● ● ● DM_PAL is
- Page 179 and 180:
PAL_FLOGISTICR_FITTED_TBL: Related
- Page 181 and 182:
The signature table should contain
- Page 183 and 184:
Table 132: Table Column Column Data
- Page 185 and 186:
Expected Result PAL_LRMC_MODEL_TBL:
- Page 187 and 188:
Table 137: Name Data Type Default V
- Page 189 and 190:
SAP HANA Predictive Analysis Librar
- Page 191 and 192:
CALL SYS.AFLLANG_WRAPPER_PROCEDURE_
- Page 193 and 194:
3.2.10 Naive Bayes Naive Bayes is a
- Page 195 and 196:
Table Column Column Data Type Descr
- Page 197 and 198:
● ● USER1 has been assigned the
- Page 199 and 200:
Table 144: Table Column Column Data
- Page 201 and 202:
"DOUBLEARGS" DOUBLE, "STRINGARGS" V
- Page 203 and 204:
Position Schema Name Table Type Nam
- Page 205 and 206:
Name Data Type Default Value Descri
- Page 207 and 208:
Name Data Type Default Value Descri
- Page 209 and 210:
DROP TABLE CV_LR_FUNC_TBL; CREATE C
- Page 211 and 212:
CREATE COLUMN TABLE FUNC_TBL LIKE F
- Page 213 and 214:
DROP TABLE EVALUATION_RESULT_TBL; C
- Page 215 and 216:
INSERT INTO PAL_PARA_TBL VALUES('TR
- Page 217 and 218:
Name Data Type Default Value Descri
- Page 219 and 220:
3.2.13 Random Forest The ransom for
- Page 221 and 222:
Table 161: Name Data Type Default V
- Page 223 and 224:
INSERT INTO PAL_RF_DATA_TBL VALUES
- Page 225 and 226:
Table Column Column Data Type Descr
- Page 227 and 228:
3.2.14 Support Vector Machine Suppo
- Page 229 and 230:
Table 168: Name Data Type Descripti
- Page 231 and 232:
Name Data Type Default Value Descri
- Page 233 and 234:
CREATE TABLE PAL_SVM_PDATA_TBL("POS
- Page 235 and 236:
The signature table should contain
- Page 237 and 238:
STRINGARGS VARCHAR(100) ); DROP TYP
- Page 239 and 240:
Example 3: Support vector classific
- Page 241 and 242:
Related Information SAP HANA Smart
- Page 243 and 244:
Table 178: Name Data Type Default V
- Page 245 and 246:
INSERT INTO PAL_GR_PDATA_TBL values
- Page 247 and 248:
Procedure Calling CALL .(, , , ) wi
- Page 249 and 250:
3.3.2 Bi-Variate Natural Logarithmi
- Page 251 and 252:
Name Data Type Default Value Descri
- Page 253 and 254:
CREATE LOCAL TEMPORARY COLUMN TABLE
- Page 255 and 256:
Table Column Column Data Type Descr
- Page 257 and 258:
Where β0…βn are parameters that
- Page 259 and 260:
Name Data Type Default Value Descri
- Page 261 and 262:
CREATE LOCAL TEMPORARY COLUMN TABLE
- Page 263 and 264:
Table Column Column Data Type Descr
- Page 265 and 266:
Assume we have m observation pairs
- Page 267 and 268:
Table 202: Name Data Type Default V
- Page 269 and 270:
Name Data Type Default Value Descri
- Page 271 and 272:
Example 1: Fitting multiple linear
- Page 273 and 274:
CREATE COLUMN TABLE PAL_ENET_MLR_PD
- Page 275 and 276:
Table 205: Table Column Column Data
- Page 277 and 278:
3.3.5 Polynomial Regression Polynom
- Page 279 and 280:
Name Data Type Default Value Descri
- Page 281 and 282:
insert into PAL_PR_PDATA_TBL values
- Page 283 and 284:
The input, parameter, and output ta
- Page 285 and 286:
3.4 Association Algorithms This sec
- Page 287 and 288:
Table 220: Name Data Type Default V
- Page 289 and 290:
Name Data Type Default Value Descri
- Page 291 and 292:
"STRINGARGS" VARCHAR (100) ); INSER
- Page 293 and 294:
Optional Parameters The following p
- Page 295 and 296:
Name Data Type Default Value Descri
- Page 297 and 298:
INSERT INTO PAL_APRIORI_DATA_TBL VA
- Page 299 and 300:
PAL_APRIORI_CONS_ITEMS_TBL: LITEAPR
- Page 301 and 302:
Name Data Type Default Value Descri
- Page 303 and 304:
INSERT INTO PAL_LITEAPRIORI_DATA_TB
- Page 305 and 306:
Table 233: Table Column Column Data
- Page 307 and 308:
Name Data Type Default Value Descri
- Page 309 and 310:
FPGROWTH (Relational Output) FP-Gro
- Page 311 and 312:
Name Data Type Default Value Descri
- Page 313 and 314:
); DROP TYPE PAL_FPGROWTH_POSTRULE_
- Page 315 and 316:
PAL_FPGROWTH_VALUES_TBL: 3.4.3 K-Op
- Page 317 and 318:
Name Data Type Default Value Descri
- Page 319 and 320:
INSERT INTO PAL_KORD_DATA_TBL VALUE
- Page 321 and 322:
Prerequisite No missing or null dat
- Page 323 and 324:
. Initial P 0 can be calculated by
- Page 325 and 326:
Output Table (Model Table) Table 24
- Page 327 and 328:
DROP TYPE PAL_ARIMAX_DATA_T; CREATE
- Page 329 and 330:
CALL "SYS".AFLLANG_WRAPPER_PROCEDUR
- Page 331 and 332:
We get And variance of the forecast
- Page 333 and 334:
CREATE COLUMN TABLE PAL_ARIMA_PDATA
- Page 335 and 336:
Table Column Column Data Type Descr
- Page 337 and 338:
INSERT INTO PAL_ARIMAX_DATA_TBL VAL
- Page 339 and 340:
3.5.2 Auto ARIMA This function auto
- Page 341 and 342:
Name Data Type Default Value Descri
- Page 343 and 344:
Name Data Type Default Value Descri
- Page 345 and 346:
● USER1 has been assigned the AFL
- Page 347 and 348:
CREATE LOCAL TEMPORARY COLUMN TABLE
- Page 349 and 350:
Example 3: Auto Seasonal ARIMA SET
- Page 351 and 352:
INSERT INTO PAL_ARIMA_DATA_TBL VALU
- Page 353 and 354:
INSERT INTO PAL_ARIMA_DATA_TBL VALU
- Page 355 and 356:
F 1 = a 0 + b 0 2. Calculation: S t
- Page 357 and 358:
Table 263: Name Data Type Default V
- Page 359 and 360:
INSERT INTO PAL_BROWNSMOOTH_DATA_TB
- Page 361 and 362:
3.5.4 Croston's Method The Croston
- Page 363 and 364:
Name Data Type Default Value Descri
- Page 365 and 366:
SELECT * FROM PAL_CROSTON_STATISTIC
- Page 367 and 368:
Table 271: Name Data Type Descripti
- Page 369 and 370:
PAL_FORECASTACCURACYMEASURES_RESULT
- Page 371 and 372:
Table 275: Name Data Type Descripti
- Page 373 and 374:
Name Data Type Default Value Descri
- Page 375 and 376:
Table 277: Table Column Column Data
- Page 377 and 378:
PAL_OUTPARAMETER_TBL: PAL_FORECASTS
- Page 379 and 380:
PAL_OUTPARAMETER_TBL: SAP HANA Pred
- Page 381 and 382:
CREATE TYPE PAL_CONTROL_T AS TABLE
- Page 383 and 384:
PAL_FORECASTTRIPLESMOOTHING_RESULT_
- Page 385 and 386:
PAL_OUTPARAMETER_TBL: PAL_FORECASTM
- Page 387 and 388:
PAL_OUTPARAMETER_TBL: PAL_FORECASTM
- Page 389 and 390:
Procedure Calling CALL .(, , , ) wi
- Page 391 and 392:
Name Data Type Default Value Descri
- Page 393 and 394:
PAL_FORECASTSLR_RESULT_TBL: PAL_FOR
- Page 395 and 396:
Note The algorithm is backward comp
- Page 397 and 398:
Name Data Type Default Value Descri
- Page 399 and 400:
INSERT INTO #PAL_CONTROL_TBL VALUES
- Page 401 and 402:
Note F 0 is not defined because the
- Page 403 and 404:
Name Data Type Default Value Descri
- Page 405 and 406:
CREATE COLUMN TABLE PAL_DOUBLESMOOT
- Page 407 and 408:
3.5.10 Triple Exponential Smoothing
- Page 409 and 410:
PAL calculates the prediction inter
- Page 411 and 412:
Name Data Type Default Value Descri
- Page 413 and 414:
Output Table Table 294: Table Colum
- Page 415 and 416:
PAL_TRIPLESMOOTH_RESULT_TBL: PAL_TR
- Page 417 and 418:
Once the trend and seasonality are
- Page 419 and 420:
Table 297: Name Data Type Default V
- Page 421 and 422:
CREATE COLUMN TABLE PAL_TSSEASONALI
- Page 423 and 424:
The difference-sign test counts the
- Page 425 and 426:
Optional Parameters The following p
- Page 427 and 428:
PAL_TSTREND_TREND_TBL: PAL_TSTREND_
- Page 429 and 430:
Parameter Table Mandatory Parameter
- Page 431 and 432:
3.6 Preprocessing Algorithms The re
- Page 433 and 434:
● ● Smoothing by bin medians: e
- Page 435 and 436:
Name Data Type Default Value Descri
- Page 437 and 438:
3.6.2 Binning Assignment Binning as
- Page 439 and 440:
Table Column Column Data Type Descr
- Page 441 and 442:
3.6.3 Convert Category Type to Bina
- Page 443 and 444:
"NAME" VARCHAR(100), "INTARGS" INTE
- Page 445 and 446:
Procedure Generation CALL SYS.AFLLA
- Page 447 and 448:
INSERT INTO PAL_IQR_TESTDT_TBL VALU
- Page 449 and 450:
PARTITION This function reads the i
- Page 451 and 452:
Name Data Type Default Value Descri
- Page 453 and 454:
3.6.6 Posterior Scaling Posterior s
- Page 455 and 456:
Table Column Column Data Type Descr
- Page 457 and 458:
Expected Result PAL_NEW_SCALING_TBL
- Page 459 and 460:
The following parameters are option
- Page 461 and 462:
INSERT INTO PAL_PCA_DATA_TBL VALUES
- Page 463 and 464:
Table 338: Table Column Column Data
- Page 465 and 466:
INSERT INTO PAL_PCAPROJ_PDATA_TBL V
- Page 467 and 468:
Table 342: Table Column Column Data
- Page 469 and 470:
INSERT INTO PAL_DISTRRANDOM_PDATA_T
- Page 471 and 472:
Table 347: Name Data Type Descripti
- Page 473 and 474:
INSERT INTO PAL_SAMPLING_DATA_TBL V
- Page 475 and 476:
If method is 4 and SAMPLING_SIZE is
- Page 477 and 478:
DROP TABLE PAL_SAMPLING_PDATA_TBL;
- Page 479 and 480:
Expected Result 3.6.10 Scaling Rang
- Page 481 and 482:
The signature table should contain
- Page 483 and 484:
● USER1 has been assigned the AFL
- Page 485 and 486:
Prerequisite Each column must conta
- Page 487 and 488:
Assume that: ● ● ● DM_PAL is
- Page 489 and 490:
PAL_MISSING_VALUES_RESULT_TBL: PAL_
- Page 491 and 492:
The procedure name is the same as s
- Page 493 and 494:
INSERT INTO PAL_VT_DATA_TBL VALUES
- Page 495 and 496:
The procedure name is the same as s
- Page 497 and 498:
3.7.2 Chi-Squared Test for Independ
- Page 499 and 500:
● USER1 has been assigned the AFL
- Page 501 and 502:
DISTRPROB This function calculates
- Page 503 and 504:
● USER1 has been assigned the AFL
- Page 505 and 506:
The signature table should contain
- Page 507 and 508:
"VALUE" DOUBLE ); DROP TABLE PDATA_
- Page 509 and 510:
Table Column Column Data Type Descr
- Page 511 and 512:
"DOUBLEARGS" DOUBLE, "STRINGARGS" V
- Page 513 and 514:
"TYPE_NAME" NVARCHAR(256), "PARAMET
- Page 515 and 516: 2. Calculate PAL also supports the
- Page 517 and 518: Assume that: ● ● ● DM_PAL is
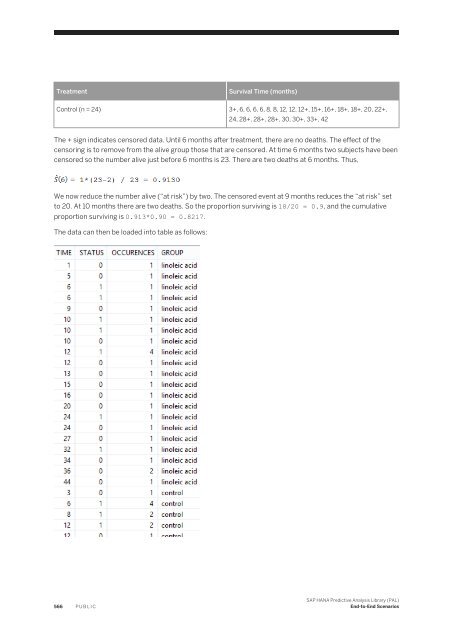
- Page 519 and 520: The Kaplan-Meier estimator can be r
- Page 521 and 522: The signature table should contain
- Page 523 and 524: Table Column Column Data Type Descr
- Page 525 and 526: PAL_KMSURV_LOGRANK_STAT2_TBL: 3.7.7
- Page 527 and 528: Table 398: Table Column Column Data
- Page 529 and 530: The signature table should contain
- Page 531 and 532: CREATE TYPE PAL_DISTRQUANTILE_RESUL
- Page 533 and 534: where x' = x - Table 404: Definitio
- Page 535 and 536: Table 408: Name Data Type Default V
- Page 537 and 538: Let the sample mean of x and y be:
- Page 539 and 540: CREATE TYPE PAL_VAREQUALTEST_DATA1_
- Page 541 and 542: The quantity is computed as a weigh
- Page 543 and 544: Table Column Column Data Type Descr
- Page 545 and 546: Prerequisites ● ● Input data ca
- Page 547 and 548: "PARAMETER_TYPE" VARCHAR(7) ); INSE
- Page 549 and 550: Signature Input Tables Table 425: T
- Page 551 and 552: CALL "SYS".AFLLANG_WRAPPER_PROCEDUR
- Page 553 and 554: "DISTANCE" DOUBLE ); DROP TYPE PAL_
- Page 555 and 556: "STRINGARGS" VARCHAR(100) ); --crea
- Page 557 and 558: The projected estimates are single
- Page 559 and 560: INSERT INTO PDATA VALUES (2, 'DM_PA
- Page 561 and 562: ----product revenue---- DELETE FROM
- Page 563 and 564: ---- calculate net present value of
- Page 565: UPDATE PAL_DISTRPROB_DISTRPARAM_TBL
- Page 569 and 570: INSERT INTO PAL_TRIAL_DATA_TBL VALU
- Page 571 and 572: INSERT INTO PAL_DISTRFITCENSORED_DA
- Page 573 and 574: The expected results are as follows
- Page 575 and 576: ); INSERT INTO PAL_DISTRPROB_PDATA_
- Page 577 and 578: Important Disclaimers and Legal Inf