

U.S Medical School First-Time Applicants 2006-2016
20161006_applicant_and_matriculant_data_tables
20161006_applicant_and_matriculant_data_tables

Create successful ePaper yourself
Turn your PDF publications into a flip-book with our unique Google optimized e-Paper software.
Contact: Brooke Bergen<br />
202-828-0419<br />
bbergen@aamc.org<br />
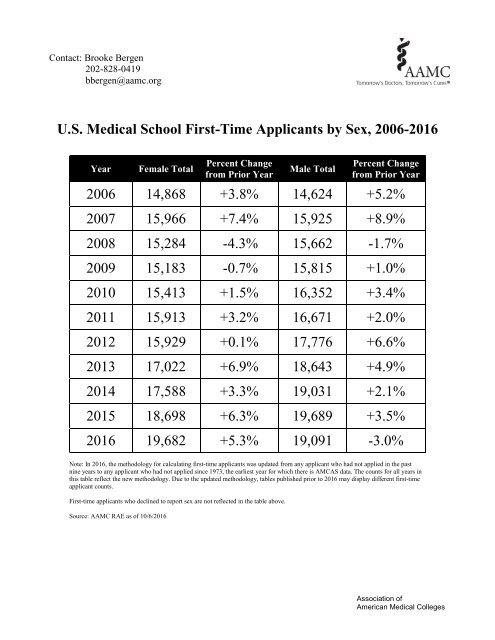
U.S. <strong>Medical</strong> <strong>School</strong> <strong>First</strong>-<strong>Time</strong> <strong>Applicants</strong> by Sex, <strong>2006</strong>-<strong>2016</strong><br />
Year<br />
Female Total<br />
Percent Change<br />
from Prior Year<br />
Male Total<br />
Percent Change<br />
from Prior Year<br />
<strong>2006</strong> 14,868 +3.8% 14,624 +5.2%<br />
2007 15,966 +7.4% 15,925 +8.9%<br />
2008 15,284 -4.3% 15,662 -1.7%<br />
2009 15,183 -0.7% 15,815 +1.0%<br />
2010 15,413 +1.5% 16,352 +3.4%<br />
2011 15,913 +3.2% 16,671 +2.0%<br />
2012 15,929 +0.1% 17,776 +6.6%<br />
2013 17,022 +6.9% 18,643 +4.9%<br />
2014 17,588 +3.3% 19,031 +2.1%<br />
2015 18,698 +6.3% 19,689 +3.5%<br />
<strong>2016</strong> 19,682 +5.3% 19,091 -3.0%<br />
Note: In <strong>2016</strong>, the methodology for calculating first-time applicants was updated from any applicant who had not applied in the past<br />
nine years to any applicant who had not applied since 1973, the earliest year for which there is AMCAS data. The counts for all years in<br />
this table reflect the new methodology. Due to the updated methodology, tables published prior to <strong>2016</strong> may display different first-time<br />
applicant counts.<br />
<strong>First</strong>-time applicants who declined to report sex are not reflected in the table above.<br />
Source: AAMC RAE as of 10/6/<strong>2016</strong><br />
Association of<br />
American <strong>Medical</strong> Colleges