

Ending Hunger What would it cost?
ending-hunger-what-would-it-cost
ending-hunger-what-would-it-cost

Create successful ePaper yourself
Turn your PDF publications into a flip-book with our unique Google optimized e-Paper software.
Modelling the Cost to End <strong>Hunger</strong><br />
We applied the MIRAGRODEP economic model—<br />
a dynamic computable general equilibrium (CGE),<br />
multi-country, and multi-sector model. The model<br />
simulated national and international markets, taking<br />
into account production, demand and prices and<br />
integrated <strong>it</strong> w<strong>it</strong>h an analysis of biophysical and<br />
socioeconomic trends (Laborde et al., 2013). The<br />
model integrated the key economic factors that affect<br />
agriculture, thereby providing a robust quant<strong>it</strong>ative<br />
framework for estimating <strong>cost</strong>s.<br />
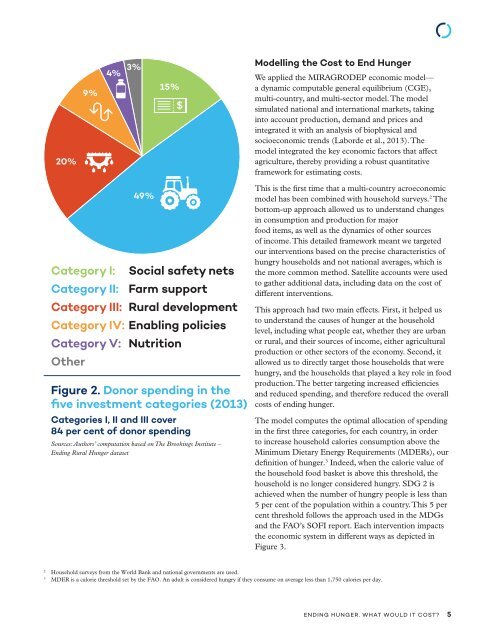
Category I: Social safety nets<br />
Category II: Farm support<br />
Category III: Rural development<br />
Category IV: Enabling policies<br />
Category V: Nutr<strong>it</strong>ion<br />
Other<br />
Figure 2. Donor spending in the<br />
five investment categories (2013)<br />
Categories I, II and III cover<br />
84 per cent of donor spending<br />
Sources: Authors’ computation based on The Brookings Inst<strong>it</strong>ute –<br />
<strong>Ending</strong> Rural <strong>Hunger</strong> dataset<br />
This is the first time that a multi-country acroeconomic<br />
model has been combined w<strong>it</strong>h household surveys. 2 The<br />
bottom-up approach allowed us to understand changes<br />
in consumption and production for major<br />
food <strong>it</strong>ems, as well as the dynamics of other sources<br />
of income. This detailed framework meant we targeted<br />
our interventions based on the precise characteristics of<br />
hungry households and not national averages, which is<br />
the more common method. Satell<strong>it</strong>e accounts were used<br />
to gather add<strong>it</strong>ional data, including data on the <strong>cost</strong> of<br />
different interventions.<br />
This approach had two main effects. First, <strong>it</strong> helped us<br />
to understand the causes of hunger at the household<br />
level, including what people eat, whether they are urban<br />
or rural, and their sources of income, e<strong>it</strong>her agricultural<br />
production or other sectors of the economy. Second, <strong>it</strong><br />
allowed us to directly target those households that were<br />
hungry, and the households that played a key role in food<br />
production. The better targeting increased efficiencies<br />
and reduced spending, and therefore reduced the overall<br />
<strong>cost</strong>s of ending hunger.<br />
The model computes the optimal allocation of spending<br />
in the first three categories, for each country, in order<br />
to increase household calories consumption above the<br />
Minimum Dietary Energy Requirements (MDERs), our<br />
defin<strong>it</strong>ion of hunger. 3 Indeed, when the calorie value of<br />
the household food basket is above this threshold, the<br />
household is no longer considered hungry. SDG 2 is<br />
achieved when the number of hungry people is less than<br />
5 per cent of the population w<strong>it</strong>hin a country. This 5 per<br />
cent threshold follows the approach used in the MDGs<br />
and the FAO’s SOFI report. Each intervention impacts<br />
the economic system in different ways as depicted in<br />
Figure 3.<br />
2<br />
Household surveys from the World Bank and national governments are used.<br />
3<br />
MDER is a calorie threshold set by the FAO. An adult is considered hungry if they consume on average less than 1,750 calories per day.<br />
ENDING HUNGER. WHAT WOULD IT COST? 5