

Biennial Report 2003-2004 - Merlin
Biennial Report 2003-2004 - Merlin
Biennial Report 2003-2004 - Merlin

Create successful ePaper yourself
Turn your PDF publications into a flip-book with our unique Google optimized e-Paper software.
12<br />
O<br />
H IGH IGH- IGH SENSITIVITY<br />
SENSITIVITY SENSITIVITY OOBSER<br />
O BSER BSERVATI BSER TI TIO TI NS NS OF<br />
OF<br />
273<br />
M ARKARIAN ARKARIAN 273<br />
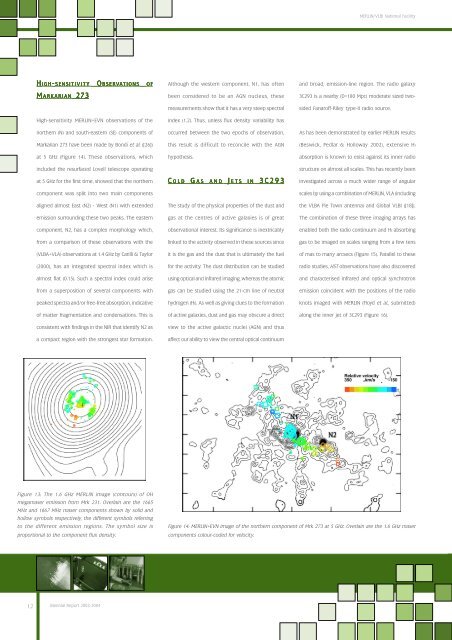
High-sensitivity MERLIN+EVN observations of the<br />
northern (N) and south-eastern (SE) components of<br />
Markarian 273 have been made by Bondi et al. ([26])<br />
at 5 GHz (Figure 14). These observations, which<br />
included the resurfaced Lovell telescope operating<br />
at 5 GHz for the first time, showed that the northern<br />
component was split into two main components<br />
aligned almost East (N2) - West (N1) with extended<br />
emission surrounding these two peaks. The eastern<br />
component, N2, has a complex morphology which,<br />
from a comparison of these observations with the<br />
(VLBA+VLA) observations at 1.4 GHz by Carilli & Taylor<br />
(2000), has an integrated spectral index which is<br />
almost flat (0.15). Such a spectral index could arise<br />
from a superposition of several components with<br />
peaked spectra and/or free-free absorption, indicative<br />
of matter fragmentation and condensations. This is<br />
consistent with findings in the NIR that identify N2 as<br />
a compact region with the strongest star formation.<br />
Figure 13: The 1.6 GHz MERLIN image (contours) of OH<br />
megamaser emission from Mrk 231. Overlain are the 1665<br />
MHz and 1667 MHz maser components shown by solid and<br />
hollow symbols respectively, the different symbols referring<br />
to the different emission regions. The symbol size is<br />
proportional to the component flux density.<br />
<strong>Biennial</strong> <strong>Report</strong> <strong>2003</strong>-<strong>2004</strong><br />
Although the western component, N1, has often<br />
been considered to be an AGN nucleus, these<br />
measurements show that it has a very steep spectral<br />
index (1.2). Thus, unless flux density variability has<br />
occurred between the two epochs of observation,<br />
this result is difficult to reconcile with the AGN<br />
hypothesis.<br />
G<br />
C OLD OLD GGAS<br />
G AS AND AND JJETS<br />
J ETS IN IN 3C293<br />
J<br />
3C293<br />
The study of the physical properties of the dust and<br />
gas at the centres of active galaxies is of great<br />
observational interest. Its significance is inextricably<br />
linked to the activity observed in these sources since<br />
it is the gas and the dust that is ultimately the fuel<br />
for the activity. The dust distribution can be studied<br />
using optical and infrared imaging, whereas the atomic<br />
gas can be studied using the 21-cm line of neutral<br />
hydrogen (HI). As well as giving clues to the formation<br />
of active galaxies, dust and gas may obscure a direct<br />
view to the active galactic nuclei (AGN) and thus<br />
affect our ability to view the central optical continuum<br />
MERLIN/VLBI National Facility<br />
and broad, emission-line region. The radio galaxy<br />
3C293 is a nearby (D=180 Mpc) moderate sized two-<br />
sided Fanaroff-Riley type-II radio source.<br />
As has been demonstrated by earlier MERLIN results<br />
(Beswick, Pedlar & Holloway 2002), extensive HI<br />
absorption is known to exist against its inner radio<br />
structure on almost all scales. This has recently been<br />
investigated across a much wider range of angular<br />
scales by using a combination of MERLIN, VLA (including<br />
the VLBA Pie Town antenna) and Global VLBI ([18]).<br />
The combination of these three imaging arrays has<br />
enabled both the radio continuum and HI absorbing<br />
gas to be imaged on scales ranging from a few tens<br />
of mas to many arcsecs (Figure 15). Parallel to these<br />
radio studies, HST observations have also discovered<br />
and characterised infrared and optical synchrotron<br />
emission coincident with the positions of the radio<br />
knots imaged with MERLIN (Floyd et al., submitted)<br />
along the inner jet of 3C293 (Figure 16).<br />
Figure 14: MERLIN+EVN image of the northern component of Mrk 273 at 5 GHz. Overlain are the 1.6 GHz maser<br />
components colour-coded for velocity.