statistics
2g0RSM6
2g0RSM6

Create successful ePaper yourself
Turn your PDF publications into a flip-book with our unique Google optimized e-Paper software.
• The net loss ratio for the short-tail property classes of business in the year ended 30 September 2016<br />
was 72 per cent, down from 75 per cent in the previous year (Chart 4). The net loss ratio for the longtail<br />
classes of business in the year ended 30 September 2016 was 62 per cent, down from 76 per cent in<br />
the previous year.<br />
• The industry underwriting expense ratio in the year ended 30 September 2016 was 26 per cent,<br />
unchanged from the previous year. Total industry underwriting expenses were $7.9 billion in the year<br />
ended 30 September 2016, down 4.6 per cent from the previous year ($8.3 billion).<br />
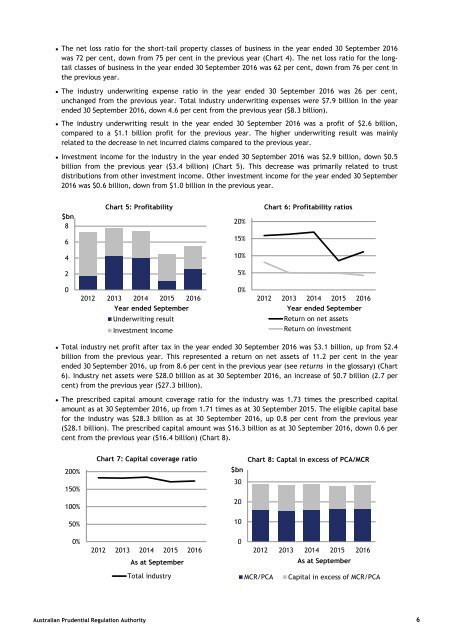
• The industry underwriting result in the year ended 30 September 2016 was a profit of $2.6 billion,<br />
compared to a $1.1 billion profit for the previous year. The higher underwriting result was mainly<br />
related to the decrease in net incurred claims compared to the previous year.<br />
• Investment income for the industry in the year ended 30 September 2016 was $2.9 billion, down $0.5<br />
billion from the previous year ($3.4 billion) (Chart 5). This decrease was primarily related to trust<br />
distributions from other investment income. Other investment income for the year ended 30 September<br />
2016 was $0.6 billion, down from $1.0 billion in the previous year.<br />
$bn<br />
8<br />
Chart 5: Profitability<br />
20%<br />
Chart 6: Profitability ratios<br />
6<br />
15%<br />
4<br />
10%<br />
2<br />
5%<br />
0<br />
2012 2013 2014 2015 2016<br />
Year ended September<br />
Underwriting result<br />
Investment income<br />
0%<br />
2012 2013 2014 2015 2016<br />
Year ended September<br />
Return on net assets<br />
Return on investment<br />
• Total industry net profit after tax in the year ended 30 September 2016 was $3.1 billion, up from $2.4<br />
billion from the previous year. This represented a return on net assets of 11.2 per cent in the year<br />
ended 30 September 2016, up from 8.6 per cent in the previous year (see returns in the glossary) (Chart<br />
6). Industry net assets were $28.0 billion as at 30 September 2016, an increase of $0.7 billion (2.7 per<br />
cent) from the previous year ($27.3 billion).<br />
• The prescribed capital amount coverage ratio for the industry was 1.73 times the prescribed capital<br />
amount as at 30 September 2016, up from 1.71 times as at 30 September 2015. The eligible capital base<br />
for the industry was $28.3 billion as at 30 September 2016, up 0.8 per cent from the previous year<br />
($28.1 billion). The prescribed capital amount was $16.3 billion as at 30 September 2016, down 0.6 per<br />
cent from the previous year ($16.4 billion) (Chart 8).<br />
200%<br />
150%<br />
Chart 7: Capital coverage ratio<br />
$bn<br />
30<br />
Chart 8: Captal in excess of PCA/MCR<br />
100%<br />
20<br />
50%<br />
10<br />
0%<br />
2012 2013 2014 2015 2016<br />
As at September<br />
0<br />
2012 2013 2014 2015 2016<br />
As at September<br />
Total industry<br />
MCR/PCA<br />
Capital in excess of MCR/PCA<br />
Australian Prudential Regulation Authority 6