

arXiv:1611.01843v2
1611.01843v2
1611.01843v2

Create successful ePaper yourself
Turn your PDF publications into a flip-book with our unique Google optimized e-Paper software.
Under review as a conference paper at ICLR 2017<br />
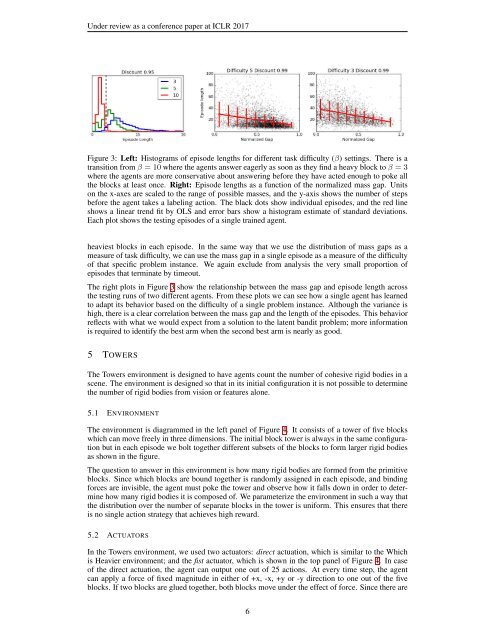
Figure 3: Left: Histograms of episode lengths for different task difficulty (β) settings. There is a<br />
transition from β = 10 where the agents answer eagerly as soon as they find a heavy block to β = 3<br />
where the agents are more conservative about answering before they have acted enough to poke all<br />
the blocks at least once. Right: Episode lengths as a function of the normalized mass gap. Units<br />
on the x-axes are scaled to the range of possible masses, and the y-axis shows the number of steps<br />
before the agent takes a labeling action. The black dots show individual episodes, and the red line<br />
shows a linear trend fit by OLS and error bars show a histogram estimate of standard deviations.<br />
Each plot shows the testing episodes of a single trained agent.<br />
heaviest blocks in each episode. In the same way that we use the distribution of mass gaps as a<br />
measure of task difficulty, we can use the mass gap in a single episode as a measure of the difficulty<br />
of that specific problem instance. We again exclude from analysis the very small proportion of<br />
episodes that terminate by timeout.<br />
The right plots in Figure 3 show the relationship between the mass gap and episode length across<br />
the testing runs of two different agents. From these plots we can see how a single agent has learned<br />
to adapt its behavior based on the difficulty of a single problem instance. Although the variance is<br />
high, there is a clear correlation between the mass gap and the length of the episodes. This behavior<br />
reflects with what we would expect from a solution to the latent bandit problem; more information<br />
is required to identify the best arm when the second best arm is nearly as good.<br />
5 TOWERS<br />
The Towers environment is designed to have agents count the number of cohesive rigid bodies in a<br />
scene. The environment is designed so that in its initial configuration it is not possible to determine<br />
the number of rigid bodies from vision or features alone.<br />
5.1 ENVIRONMENT<br />
The environment is diagrammed in the left panel of Figure 4. It consists of a tower of five blocks<br />
which can move freely in three dimensions. The initial block tower is always in the same configuration<br />
but in each episode we bolt together different subsets of the blocks to form larger rigid bodies<br />
as shown in the figure.<br />
The question to answer in this environment is how many rigid bodies are formed from the primitive<br />
blocks. Since which blocks are bound together is randomly assigned in each episode, and binding<br />
forces are invisible, the agent must poke the tower and observe how it falls down in order to determine<br />
how many rigid bodies it is composed of. We parameterize the environment in such a way that<br />
the distribution over the number of separate blocks in the tower is uniform. This ensures that there<br />
is no single action strategy that achieves high reward.<br />
5.2 ACTUATORS<br />
In the Towers environment, we used two actuators: direct actuation, which is similar to the Which<br />
is Heavier environment; and the fist actuator, which is shown in the top panel of Figure 4. In case<br />
of the direct actuation, the agent can output one out of 25 actions. At every time step, the agent<br />
can apply a force of fixed magnitude in either of +x, -x, +y or -y direction to one out of the five<br />
blocks. If two blocks are glued together, both blocks move under the effect of force. Since there are<br />
6