National Poll Report for IOG Sept 2014

You also want an ePaper? Increase the reach of your titles
YUMPU automatically turns print PDFs into web optimized ePapers that Google loves.
Statements<br />
I would be willing to pay more<br />
in taxes to increase police pay<br />
to attract quality officers<br />
I do all that I can to avoid police<br />
officers<br />
I have taught children or my<br />
own children to avoid police<br />
officers<br />
Based on all I know or have<br />
heard, African-Americans are<br />
justified when they report<br />
fearing the police<br />
Strongly<br />
Agree<br />
Somewhat<br />
Agree<br />
Somewhat<br />
Disagree<br />
Strongly<br />
Disagree<br />
Unsure<br />
or N/A<br />
15.6 45.3 19.0 13.6 6.6<br />
12.3 220 26.6 34.8 4.3<br />
4.9 6.6 17.9 54.4 16.2<br />
16.6 31.0 24.1 18.7 9.7<br />
GUN CONTROL / OWNERSHIP<br />
History of Ownership<br />
In the next survey section, researchers collected current views of Americans on issues related<br />
to gun / firearm controls and ownership.<br />
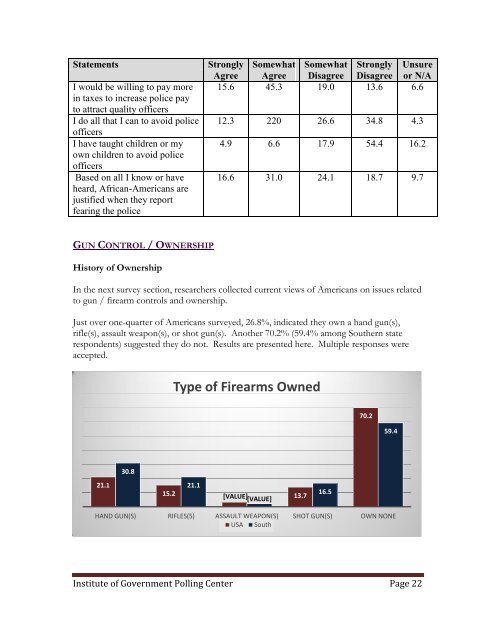
Just over one-quarter of Americans surveyed, 26.8%, indicated they own a hand gun(s),<br />
rifle(s), assault weapon(s), or shot gun(s). Another 70.2% (59.4% among Southern state<br />
respondents) suggested they do not. Results are presented here. Multiple responses were<br />
accepted.<br />
Type of Firearms Owned<br />
70.2<br />
59.4<br />
30.8<br />
21.1<br />
21.1<br />
15.2 [VALUE] [VALUE]<br />
13.7<br />
16.5<br />
HAND GUN(S) RIFLES(S) ASSAULT WEAPON(S) SHOT GUN(S) OWN NONE<br />
USA South<br />
Institute of Government <strong>Poll</strong>ing Center Page 22