JSU Fall 2014-4 Report

Create successful ePaper yourself
Turn your PDF publications into a flip-book with our unique Google optimized e-Paper software.
4<br />
SUMMARY OF FINDINGS<br />
Readers are reminded that the narrative throughout this report refers to composite aggregate<br />
data – the 908 completed surveys. Tables throughout present national results while many<br />
graphs also present results southern states – Alabama, Arkansas, Georgia, Louisiana,<br />
Mississippi, North Carolina, South Carolina, Tennessee and Virginia. Further, the results<br />
from the Mississippi sample are also displayed throughout this report in most graphs and<br />
tables.<br />
EDUCATION QUALITY<br />
Readers should note that many tables and graphs displayed depicting the education poll<br />
results also hold data for respondents with children as well.<br />
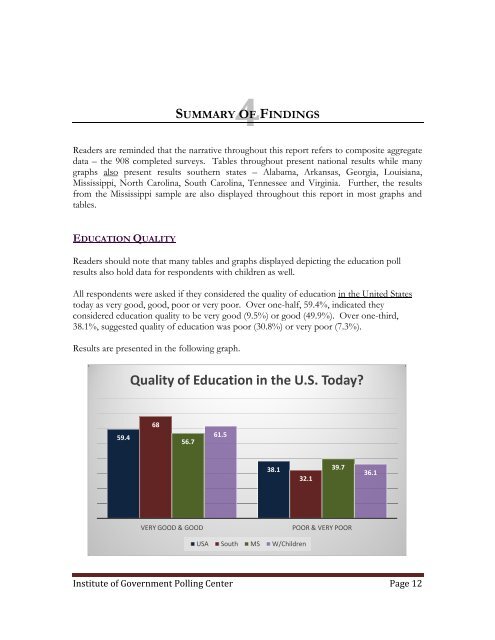
All respondents were asked if they considered the quality of education in the United States<br />
today as very good, good, poor or very poor. Over one-half, 59.4%, indicated they<br />
considered education quality to be very good (9.5%) or good (49.9%). Over one-third,<br />
38.1%, suggested quality of education was poor (30.8%) or very poor (7.3%).<br />
Results are presented in the following graph.<br />
Quality of Education in the U.S. Today?<br />
59.4<br />
68<br />
56.7<br />
61.5<br />
38.1<br />
32.1<br />
39.7<br />
36.1<br />
VERY GOOD & GOOD<br />
POOR & VERY POOR<br />
USA South MS W/Children<br />
Institute of Government Polling Center Page 12