

http://cercor.oxfordjournals.org/
zeppjbn
zeppjbn

Create successful ePaper yourself
Turn your PDF publications into a flip-book with our unique Google optimized e-Paper software.
4 | Cerebral Cortex<br />
experiments. To control for effects of target trials, the number<br />
of target trials and the location of dots on target trials were<br />
matched across the same- and different-identity blocks.<br />
Eyetracking<br />
To determine whether participants were attending to the faces,<br />
we monitored and recorded participants’ eye movements during<br />
thescanningsessionusinga50Hzmonocularmagneticresonance<br />
imaging (MRI)-compatible infrared eyetracker (SensoMotoric<br />
Instruments, SMI). Eyetracking data were analysed with SMI<br />
BeGaze3.0 software. A rectangular area-of-interest (AOI) was created<br />
around the inner part of the upper face for each 3 image sizes<br />
separately. Average dwell time in the AOI was measured for each<br />
condition (excluding target trials). During scanning, participants<br />
were instructed to attend to a fixation cross which appeared during<br />
each ISI, and was positioned in a location equivalent to the<br />
center of the eyes.<br />
Imaging Parameters<br />
MRI scanning was performed on a Siemens Tim Trio 3-Tesla MR<br />
scanner with a 32-channel head coil. Brain data were acquired<br />
with T2*-weighted echo-planar imaging sensitive to BOLD signal<br />
contrast. Each image volume consisted of 32 3 mm thick slices<br />
(voxel size 3 × 3 × 3 mm; slice gap 25%; FOV 192 × 192 mm; flip<br />
angle 78°; time echo 30 ms; time repetition 2 s). Slices were<br />
acquired sequentially in an oblique axial orientation aligned<br />
along the ventral temporal lobes. The first 3 volumes were discarded<br />
to allow for the effects of magnetic saturation. A highresolution<br />
structural magnetization prepared rapid gradient echo<br />
scan was also acquired at a resolution of 1 × 1 × 1 mm. Following<br />
a scanner upgrade, 2 participants (1 ASC) were scanned (with an<br />
identical acquisition sequence) using a Siemens MAGNETOM<br />
Prisma-fit 3-Tesla MR scanner with a 64-channel head coil. To<br />
model any effects of the upgrade, scanner was included as a covariate<br />
in all analyses.<br />
fMRI Analysis<br />
Data were analysed using SPM 8 software (Wellcome Trust<br />
Centre for Neuroimaging). Standard pre-processing was<br />
applied, including correction for slice-timing and head motion.<br />
Each participant’s scans were normalized using the linear and<br />
nonlinear normalization parameters estimated from warping<br />
the participant’s structural image to the Montreal Neurological<br />
Institute (MNI)—ICBM avg152 T1 weighted template, using<br />
2 mm isotropic voxels and smoothed with a Gaussian kernel of<br />
8 mm full-width half-maximum. Blocks of each condition were<br />
modeled by sustained epochs of neural activity (boxcars) convolved<br />
with a canonical hemodynamic response function.<br />
Realignment parameters were included as effects of no interest<br />
to account for motion-related variance. A high pass filter of<br />
128 s was used to remove low-frequency noise.<br />
factor and scanner as a covariate. Experiment 2 included Repetition<br />
(same-shape, different-shape) and Image Color (same-color, different-color)<br />
as repeated measures factors. RS was defined as a greater<br />
response to different-identity/shape conditions relative to sameidentity/shape<br />
conditions. To examine the influence of autistic<br />
traits on RS to faces and shapes, we performed additional<br />
ANCOVAs for each ROI including AQ scores as a covariate.<br />
Whole Brain Analysis<br />
In both experiments we determined whether regions outside of<br />
the category-selective ROIs showed a group difference in RS by<br />
performing an exploratory whole brain analysis. First-level images<br />
of contrast estimates (Different-Identity/Shape > Same-Identity/<br />
Shape) were entered into an independent samples t-test to compare<br />
RS between groups (P < 0.001 uncorrected, 10 contiguous<br />
voxels). To determine the relationship between individual<br />
variation in face memory and RS to faces, first-level images of<br />
contrast estimates (Different-Identity > Same-Identity) were<br />
entered into whole-brain regression analysis with CFMT and<br />
CCMT scores as covariates (P < 0.001 uncorrected, 10 contiguous<br />
voxels). Scanner was included as a covariate of no interest in all<br />
whole brain analyses.<br />
Results<br />
Behavioral Tests<br />
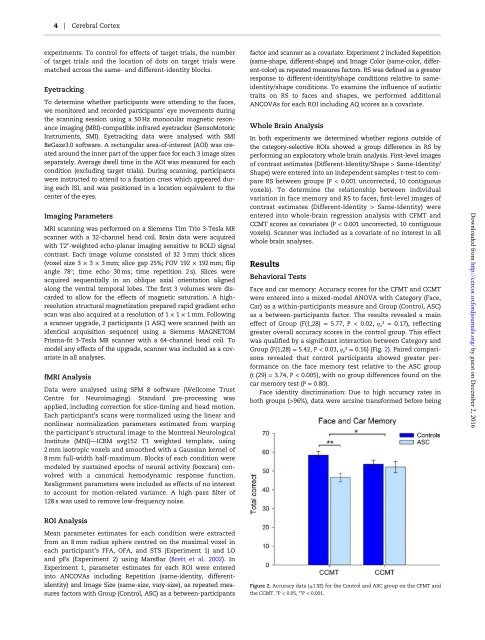
Face and car memory: Accuracy scores for the CFMT and CCMT<br />
were entered into a mixed-model ANOVA with Category (Face,<br />
Car) as a within-participants measure and Group (Control, ASC)<br />
as a between-participants factor. The results revealed a main<br />
effect of Group (F(1,28) = 5.77, P < 0.02, η ρ ² = 0.17), reflecting<br />
greater overall accuracy scores in the control group. This effect<br />
was qualified by a significant interaction between Category and<br />
Group (F(1,28) = 5.42, P < 0.03, η ρ ² = 0.16) (Fig. 2). Paired comparisons<br />
revealed that control participants showed greater performance<br />
on the face memory test relative to the ASC group<br />
(t (29) = 3.74, P < 0.005), with no group differences found on the<br />
car memory test (P = 0.80).<br />
Face identity discrimination: Due to high accuracy rates in<br />
both groups (>96%), data were arcsine transformed before being<br />
Downloaded from <strong>http</strong>://<strong>cercor</strong>.<strong>oxfordjournals</strong>.<strong>org</strong>/ by guest on December 2, 2016<br />
ROI Analysis<br />
Mean parameter estimates for each condition were extracted<br />
from an 8 mm radius sphere centred on the maximal voxel in<br />
each participant’s FFA, OFA, and STS (Experiment 1) and LO<br />
and pFs (Experiment 2) using MarsBar (Brett et al. 2002). In<br />
Experiment 1, parameter estimates for each ROI were entered<br />
into ANCOVAs including Repetition (same-identity, differentidentity)<br />
and Image Size (same-size, vary-size), as repeated measures<br />
factors with Group (Control, ASC) as a between-participants<br />
Figure 2. Accuracy data (±1 SE) for the Control and ASC group on the CFMT and<br />
the CCMT. *P < 0.05, **P < 0.001.