OF RUSSIAN SCHOOL SIMILARITIES AND DIFFERENCES
n?u=RePEc:hig:wpaper:66psy2016&r=edu
n?u=RePEc:hig:wpaper:66psy2016&r=edu

You also want an ePaper? Increase the reach of your titles
YUMPU automatically turns print PDFs into web optimized ePapers that Google loves.
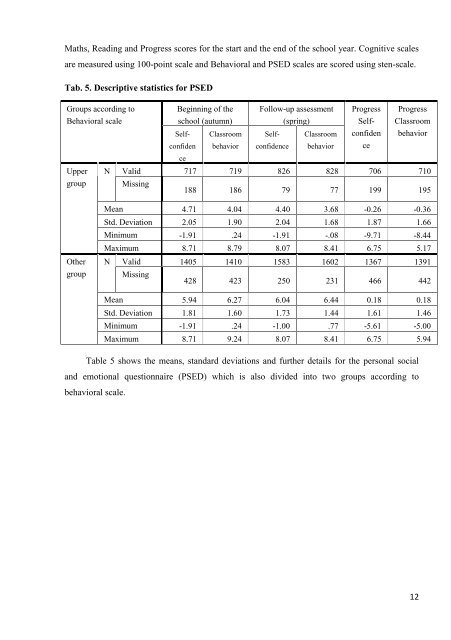
Maths, Reading and Progress scores for the start and the end of the school year. Cognitive scales<br />
are measured using 100-point scale and Behavioral and PSED scales are scored using sten-scale.<br />
Tab. 5. Descriptive statistics for PSED<br />
Groups according to<br />
Behavioral scale<br />
Beginning of the<br />
school (autumn)<br />
Follow-up assessment<br />
(spring)<br />
Progress<br />
Selfconfiden<br />
Progress<br />
Classroom<br />
Selfconfiden<br />
Classroom<br />
behavior<br />
Selfconfidence<br />
Classroom<br />
behavior ce<br />
behavior<br />
ce<br />
Upper N Valid 717 719 826 828 706 710<br />
group Missing<br />
188 186 79 77 199 195<br />
Mean 4.71 4.04 4.40 3.68 -0.26 -0.36<br />
Other<br />
group<br />
Std. Deviation 2.05 1.90 2.04 1.68 1.87 1.66<br />
Minimum -1.91 .24 -1.91 -.08 -9.71 -8.44<br />
Maximum 8.71 8.79 8.07 8.41 6.75 5.17<br />
N Valid 1405 1410 1583 1602 1367 1391<br />
Missing<br />
428 423 250 231 466 442<br />
Mean 5.94 6.27 6.04 6.44 0.18 0.18<br />
Std. Deviation 1.81 1.60 1.73 1.44 1.61 1.46<br />
Minimum -1.91 .24 -1.00 .77 -5.61 -5.00<br />
Maximum 8.71 9.24 8.07 8.41 6.75 5.94<br />
Table 5 shows the means, standard deviations and further details for the personal social<br />
and emotional questionnaire (PSED) which is also divided into two groups according to<br />
behavioral scale.<br />
12