Untitled - Medicinski fakultet Kragujevac - Univerzitet u Kragujevcu
Untitled - Medicinski fakultet Kragujevac - Univerzitet u Kragujevcu
Untitled - Medicinski fakultet Kragujevac - Univerzitet u Kragujevcu

You also want an ePaper? Increase the reach of your titles
YUMPU automatically turns print PDFs into web optimized ePapers that Google loves.
50<br />
INTRODUCTION<br />
The primary function of the anterior cruciate ligament<br />
(ACL) is to control the anterior dislocation of the tibia, preventing<br />
hyperextension of the lower leg and disabling excessive<br />
axial rotation of the knee during extension [1]. Anterior<br />
cruciate ligament injuries are a relatively common in young<br />
athletes [2]. The typical orthopaedic treatment involves the<br />
surgical reconstruction of the ACL. In the U.S., more than<br />
100 000 reconstructions of the ACL are performed per year.<br />
The purpose of the ACL reconstruction is to achieve stability<br />
in the entire range of motion of the knee, enabling the<br />
patient to perform everyday activities and sports-related activities,<br />
and to prevent new chondral and meniscoligamental<br />
injuries [3] and early arthritis. Additionally, ACL reconstruction<br />
should re-establish the normal gait pattern, which<br />
is distorted in patients with chronic ACL rupture. The gait<br />
pattern of patients with ACL injuries is changed due to a significant<br />
increase in the anterior-posterior (AP) translation<br />
of the tibia relative to the femur and internal-external (IE)<br />
rotation during specific phases of the gait cycle.<br />
The aim of the study is to present a more precise and<br />
objective method of gait analysis before and after surgery<br />
in patients with ACL rupture.<br />
MATERIALS AND METHODS<br />
Nineteen adult men volunteered to perform the<br />
gait analysis test. The mean height of the subjects was<br />
183.33±2.24 cm, mean weight 86±3.48 kg, and mean age<br />
29.89±1.73. The subjects were recreational or professional<br />
athletes with a history of arthroscopic reconstruction<br />
of the ACL after a severe knee injury; the reconstruction<br />
involved the use of the semitendinosus and gracilis muscle<br />
tendons as nthe autograftdiagnosis . Test analysis and<br />
surgery were performed at the <strong>Kragujevac</strong> Clinical Centre<br />
(Clinic for Orthopedics and Traumatology).<br />
RVT<br />
LEF<br />
TT<br />
CSZ<br />
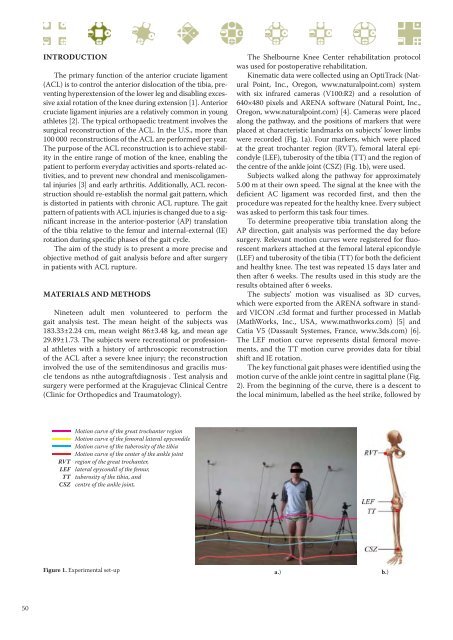
Motion curve of the great trochanter region<br />
Motion curve of the femoral lateral epycondile<br />
Motion curve of the tuberosity of the tibia<br />
Motion curve of the center of the ankle joint<br />
region of the great trochanter,<br />
lateral epycondil of the femur,<br />
tuberosity of the tibia, and<br />
centre of the ankle joint,<br />
Figure 1. Experimental set-up<br />
The Shelbourne Knee Center rehabilitation protocol<br />
was used for postoperative rehabilitation.<br />
Kinematic data were collected using an OptiTrack (Natural<br />
Point, Inc., Oregon, www.naturalpoint.com) system<br />
with six infrared cameras (V100:R2) and a resolution of<br />
640×480 pixels and ARENA software (Natural Point, Inc.,<br />
Oregon, www.naturalpoint.com) [4]. Cameras were placed<br />
along the pathway, and the positions of markers that were<br />
placed at characteristic landmarks on subjects’ lower limbs<br />
were recorded (Fig. 1a). Four markers, which were placed<br />
at the great trochanter region (RVT), femoral lateral epicondyle<br />
(LEF), tuberosity of the tibia (TT) and the region of<br />
the centre of the ankle joint (CSZ) (Fig. 1b), were used.<br />
Subjects walked along the pathway for approximately<br />
5.00 m at their own speed. The signal at the knee with the<br />
deficient AC ligament was recorded first, and then the<br />
procedure was repeated for the healthy knee. Every subject<br />
was asked to perform this task four times.<br />
To determine preoperative tibia translation along the<br />
AP direction, gait analysis was performed the day before<br />
surgery. Relevant motion curves were registered for fluorescent<br />
markers attached at the femoral lateral epicondyle<br />
(LEF) and tuberosity of the tibia (TT) for both the deficient<br />
and healthy knee. The test was repeated 15 days later and<br />
then after 6 weeks. The results used in this study are the<br />
results obtained after 6 weeks.<br />
The subjects’ motion was visualised as 3D curves,<br />
which were exported from the ARENA software in standard<br />
VICON .c3d format and further processed in Matlab<br />
(MathWorks, Inc., USA, www.mathworks.com) [5] and<br />
Catia V5 (Dassault Systemes, France, www.3ds.com) [6].<br />
The LEF motion curve represents distal femoral movements,<br />
and the TT motion curve provides data for tibial<br />
shift and IE rotation.<br />
The key functional gait phases were identified using the<br />
motion curve of the ankle joint centre in sagittal plane (Fig.<br />
2). From the beginning of the curve, there is a descent to<br />
the local minimum, labelled as the heel strike, followed by<br />
a.) b.)