

Core Connections Algebra 2
alg2_selected%20answers
alg2_selected%20answers

You also want an ePaper? Increase the reach of your titles
YUMPU automatically turns print PDFs into web optimized ePapers that Google loves.
Lesson 9.3.3<br />
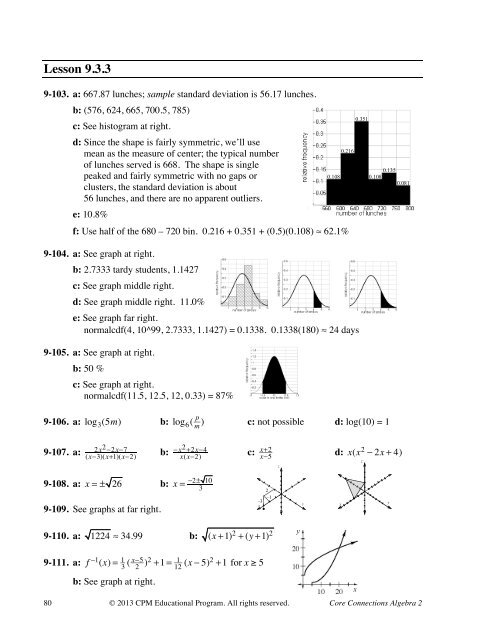
9-103. a: 667.87 lunches; sample standard deviation is 56.17 lunches.<br />
b: (576, 624, 665, 700.5, 785)<br />
c: See histogram at right.<br />
d: Since the shape is fairly symmetric, we’ll use<br />
mean as the measure of center; the typical number<br />
of lunches served is 668. The shape is single<br />
peaked and fairly symmetric with no gaps or<br />
clusters, the standard deviation is about<br />
56 lunches, and there are no apparent outliers.<br />
e: 10.8%<br />
f: Use half of the 680 – 720 bin. 0.216 + 0.351 + (0.5)(0.108) ≈ 62.1%<br />
9-104. a: See graph at right.<br />
b: 2.7333 tardy students, 1.1427<br />
c: See graph middle right.<br />
d: See graph middle right. 11.0%<br />
e: See graph far right.<br />
normalcdf(4, 10^99, 2.7333, 1.1427) = 0.1338. 0.1338(180) ≈ 24 days<br />
9-105. a: See graph at right.<br />
b: 50 %<br />
c: See graph at right.<br />
normalcdf(11.5, 12.5, 12, 0.33) = 87%<br />
9-106. a: log 3 (5m) b: log 6 ( p m<br />
) c: not possible d: log(10) = 1<br />
0.108<br />
0.216<br />
0.351<br />
0.135<br />
0.108<br />
0.081<br />
9-107. a:<br />
2x 2 −2x−7<br />
(x−3)(x+1)(x−2)<br />
b: −x2 +2x−4<br />
c:<br />
x(x−2) x+2<br />
x−5 d: x(x2 − 2x + 4)<br />
z<br />
z<br />
9-108. a: x = ± 26 b: x =<br />
9-109. See graphs at far right.<br />
−2± 10<br />
3<br />
–3<br />
x<br />
2<br />
–1<br />
y<br />
x<br />
y<br />
9-110. a: 1224 ≈ 34.99 b: (x +1) 2 + (y +1) 2<br />
y<br />
9-111. a: f −1 (x) = 1 3 ( x−5<br />
2 )2 +1 = 1<br />
12 (x − 5)2 +1 for x ≥ 5<br />
b: See graph at right.<br />
80 © 2013 CPM Educational Program. All rights reserved. <strong>Core</strong> <strong>Connections</strong> <strong>Algebra</strong> 2<br />
x