PORCUPINE MARINE NATURAL HISTORY SOCIETY NEWSLETTER
PORCUPINE MARINE NATURAL HISTORY SOCIETY NEWSLETTER
PORCUPINE MARINE NATURAL HISTORY SOCIETY NEWSLETTER

You also want an ePaper? Increase the reach of your titles
YUMPU automatically turns print PDFs into web optimized ePapers that Google loves.
44<br />
species records by major regional blocks, from the<br />
relatively species rich SW, through NW and NE to the<br />
relatively species poor SE (Figure 5).<br />
Fig. 5. Number of species recorded from each major<br />
regional block.<br />
A similar pattern was seen in the numbers of species<br />
with different distribution permutations (Figure 6).<br />
The largest group (to the left of the chart) represents<br />
those species (47%) that have been recorded from all<br />
four regional blocks. The second largest group (10%)<br />
was for those species found in all areas except the<br />
SE (XSE in Figure 6). The third largest group (8%)<br />
included those species recorded only from the SW<br />
(NB: in Figure 6 ‘SW’ represents SW only).<br />
Fig. 6. Numbers of species recorded from different<br />
permutations of distribution between regional blocks.<br />
The key lists permutations in sequence, as they appear<br />
clockwise in the chart, beginning with the ‘12:00’<br />
position.<br />
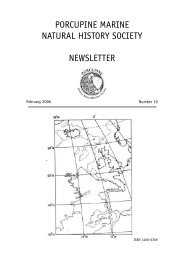
Improved detail could be seen on Sea Area maps<br />
produced for individual species chosen to represent<br />
each permutation. One example is shown below<br />
(Figure 7) to represent ‘distributed in all regions<br />
but the SE’, the most common regional distribution<br />
permutation (other than ubiquitous).<br />
PMNHS Newsletter No.24 Summer 2008<br />
Fig. 7. Sea area distributions and photograph for<br />
Lepedepecreum longicorne.<br />
Discussion<br />
While it was not possible to confidently identify<br />
regional faunule boundaries with the data collated<br />
to date, this analysis provides quantitative evidence<br />
for a commonly observed pattern in the marine<br />
biogeography of the British Isles: that is, species<br />
richness is highest in the southwest and lowest in<br />
the southeast. These patterns could be explained in<br />
terms of sensitivity to low winter temperatures or<br />
high summer temperatures, respectively for warm or<br />
cold water species:<br />
(i) highest species richness in the southwest, as<br />
a result of warm water species, followed by the<br />
northwest and northeast,<br />
(ii) moderately increased species richness in the<br />
northwest and northeast, as a result of cold water<br />
species,<br />
(iii) low species richness in the southeast, by<br />
default.<br />
The concepts are illustrated by the following<br />
figure.<br />
Fig. 8. Stylised warm and cold water faunal influences<br />
around the British Isles; numbers of species involved<br />
are indicated by thickness of arrows, which do not<br />
necessarily imply short-term movement of animals.<br />
There are other potential explanations for the<br />
observed patterns. There may be low larval dispersal<br />
to the southeast, due to the greater movement of<br />
water over deeper areas. Another explanation might<br />
be that habitat diversity is low in the southeast. The<br />
fact that the area is deficient in deep water habitats<br />
was factored out as far as possible, through the<br />
elimination of deep water species and offshore Sea<br />
Areas from the analyses. The low diversity of some<br />
other habitats, such as hard substratum communities<br />
remains a potential explanation for the pattern,<br />
although the absence of certain biogenic habitats<br />
could be considered a function of low species<br />
richness in itself.