Erickson-Indiana-bat
Erickson-Indiana-bat
Erickson-Indiana-bat

Create successful ePaper yourself
Turn your PDF publications into a flip-book with our unique Google optimized e-Paper software.
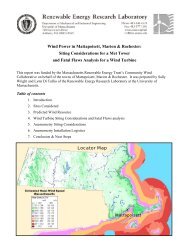
No WNS Low WNS Mortality Medium WNS Mortality High WNS Mortality<br />
45<br />
Latitude<br />
40<br />
35<br />
30<br />
45<br />
40<br />
35<br />
30<br />
45<br />
40<br />
35<br />
b) Low c) Medium d) High<br />
30<br />
−90 −80 −70 −90 −80 −70 −90 −80 −70 −90 −80 −70<br />
Longitude<br />
Figure 4 Map of maternity colonies lost under different exposure scenarios. The figure is faceted on<br />
the x-axis by different WNS mortality scenarios. The figure is faceted on the y-axis by different wind turbine<br />
mortality rates. We only show the results from including turbines found within a 2-km buffer of the<br />
migratory pathway. We also did not plot the scenarios that only included take occurring along migratory<br />
pathways. The shading is the relative density of colonies lost. The density is subplot specific and only qualitative<br />
comparisons should be made across subplots. Furthermore, the area and shading of the density<br />
varies across plots because of the the shading algorithm used by ggplot2. This plotting program shrinks the<br />
density as the number of points increases and the variability among points decreases.<br />
diminishing return), such that further increases in the mortality rate from wind turbines,<br />
as they are currently configured across the United States, would have little additional effect<br />
because wind turbines removed all groups affected by energy generation. Thus, the <strong>bat</strong>s<br />
are depopulated from the turbine areas when mortality is high.<br />
DISCUSSION<br />
The current juxtaposition of wind energy facilities within the range of the <strong>Indiana</strong> <strong>bat</strong> may<br />
lead to a meaningful impact on the population dynamics of the species, depending upon the<br />
magnitude of risk from collision faced by <strong>bat</strong>s in migration. Although wind energy may have<br />
some effect on the simulated total population size (Fig. 3), the effects of wind turbines on the<br />
metapopulation dynamics and, specifically, on migrational connectivity of the <strong>Indiana</strong> <strong>bat</strong><br />
are likely more important owing to the reduction in number of migratory pathways within<br />
our model (Fig. S1). At the simulated rates of mortality from turbines, wind energy facilities<br />
hold the potential to extirpate smaller over-wintering populations (Barclay & Harder, 2003;<br />
Jones, Purvis & Gittleman, 2003). Survival of these smaller sub-populations is likely critical<br />
for the species to survive WNS because smaller winter colonies appear less at risk from<br />
WNS (Thogmartin et al., 2012b; Wilder et al., 2011). This finding also highlights important<br />
differences in compensatory and additive mortality. At the population-level, wind turbine<br />
development and white-nose syndrome appear to be compensatory sources of mortality<br />
(i.e., if wind turbines did not kill <strong>Indiana</strong> <strong>bat</strong>s, white-nose syndrome would kill them<br />
<strong>Erickson</strong> et al. (2016), PeerJ, DOI 10.7717/peerj.2830 9/19