

SPC BENCHMARK 1 EXECUTIVE SUMMARY NETAPP INC
eQvUafc
eQvUafc

You also want an ePaper? Increase the reach of your titles
YUMPU automatically turns print PDFs into web optimized ePapers that Google loves.
<strong>EXECUTIVE</strong> <strong>SUMMARY</strong> Page 6 of 10<br />
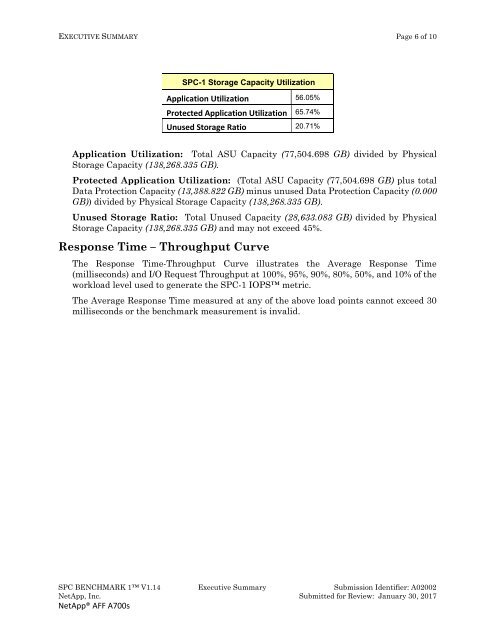
<strong>SPC</strong>-1 Storage Capacity Utilization<br />
Application Utilization 56.05%<br />
Protected Application Utilization 65.74%<br />
Unused Storage Ratio 20.71%<br />
Application Utilization: Total ASU Capacity (77,504.698 GB) divided by Physical<br />
Storage Capacity (138,268.335 GB).<br />
Protected Application Utilization: (Total ASU Capacity (77,504.698 GB) plus total<br />
Data Protection Capacity (13,388.822 GB) minus unused Data Protection Capacity (0.000<br />
GB)) divided by Physical Storage Capacity (138,268.335 GB).<br />
Unused Storage Ratio: Total Unused Capacity (28,633.083 GB) divided by Physical<br />
Storage Capacity (138,268.335 GB) and may not exceed 45%.<br />
Response Time – Throughput Curve<br />
The Response Time-Throughput Curve illustrates the Average Response Time<br />
(milliseconds) and I/O Request Throughput at 100%, 95%, 90%, 80%, 50%, and 10% of the<br />
workload level used to generate the <strong>SPC</strong>-1 IOPS metric.<br />
The Average Response Time measured at any of the above load points cannot exceed 30<br />
milliseconds or the benchmark measurement is invalid.<br />
<strong>SPC</strong> <strong>BENCHMARK</strong> 1 V1.14 Executive Summary Submission Identifier: A02002<br />
NetApp, Inc. Submitted for Review: January 30, 2017<br />
NetApp® AFF A700s