

Methodology
electricitypricing
electricitypricing

Create successful ePaper yourself
Turn your PDF publications into a flip-book with our unique Google optimized e-Paper software.
2010 and 2015. Meanwhile, the next worse performer, Indiana, experienced an<br />
increase of just 13.5 percent. Rates in Texas, Illinois, and Tennessee decreased.<br />
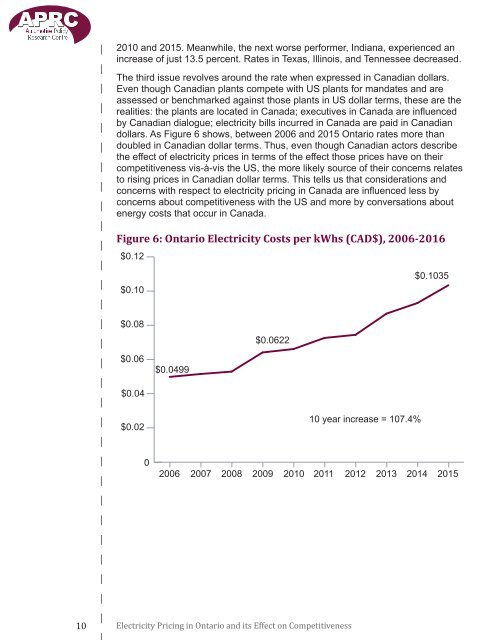
The third issue revolves around the rate when expressed in Canadian dollars.<br />
Even though Canadian plants compete with US plants for mandates and are<br />
assessed or benchmarked against those plants in US dollar terms, these are the<br />
realities: the plants are located in Canada; executives in Canada are influenced<br />
by Canadian dialogue; electricity bills incurred in Canada are paid in Canadian<br />
dollars. As Figure 6 shows, between 2006 and 2015 Ontario rates more than<br />
doubled in Canadian dollar terms. Thus, even though Canadian actors describe<br />
the effect of electricity prices in terms of the effect those prices have on their<br />
competitiveness vis-à-vis the US, the more likely source of their concerns relates<br />
to rising prices in Canadian dollar terms. This tells us that considerations and<br />
concerns with respect to electricity pricing in Canada are influenced less by<br />
concerns about competitiveness with the US and more by conversations about<br />
energy costs that occur in Canada.<br />
Figure 6: Ontario Electricity Costs per kWhs (CAD$), 2006-2016<br />
$0.12<br />
$0.10<br />
$0.1035<br />
$0.08<br />
$0.0622<br />
$0.06<br />
$0.0499<br />
$0.04<br />
$0.02<br />
10 year increase = 107.4%<br />
0<br />
2006 2007 2008 2009 2010 2011 2012 2013 2014 2015<br />
10 Electricity Pricing in Ontario and its Effect on Competitiveness