

Investigation on the Performance of Pico-hydro Generation System ...
Investigation on the Performance of Pico-hydro Generation System ...
Investigation on the Performance of Pico-hydro Generation System ...

You also want an ePaper? Increase the reach of your titles
YUMPU automatically turns print PDFs into web optimized ePapers that Google loves.
additi<strong>on</strong>, <strong>the</strong> estimated maximum power will be used to<br />
verify <strong>the</strong> efficiency <strong>of</strong> <strong>the</strong> pico-<strong>hydro</strong> system.<br />
C. Battery Charging Ability Test<br />
This test is carried out to determine <strong>the</strong> ability <strong>of</strong> <strong>the</strong><br />
pico-<strong>hydro</strong> system to store energy. Thus, a 9.6V,<br />
700mAh, Ni-cad rechargeable battery shown in Fig. 1 has<br />
been tested. This type <strong>of</strong> battery is normally used for<br />
robotic and radio/remote c<strong>on</strong>trol toys.<br />
Fig. 1 A 9.6V, 700mAh Ni-cad rechargeable battery pack<br />
3. Results <strong>of</strong> <strong>Performance</strong><br />
A. Open Circuit Test<br />
The open circuit test results in Table 1 show <strong>the</strong> water<br />
pressure level, rate <strong>of</strong> water flow, open circuit voltage and<br />
generator speed within 24 hours test.<br />
TABLE 1 OPEN CIRCUIT TEST RESULTS<br />
Time<br />
Speed<br />
(rpm)<br />
Voltage<br />
(V)<br />
Pressure<br />
(psi)<br />
Water Flow<br />
Rate (l/s)<br />
1.00 am 1601 71.8 18 0.240<br />
2.00 am 1602 70.9 18 0.240<br />
3.00 am 1604 71.9 18 0.240<br />
4.00 am 1600 70.1 18 0.238<br />
5.00 am 1597 69.3 18 0.238<br />
6.00 am 1432 66.5 17 0.238<br />
7.00 am 1410 64.4 17 0.236<br />
8.00 am 1318 60.2 15 0.232<br />
9.00 am 1300 60.0 15 0.232<br />
10.00 am 1250 57.2 15 0.230<br />
11.00 am 1246 56.9 15 0.230<br />
12.00 pm 1105 49.8 13 0.225<br />
1.00 pm 1320 60.9 15 0.232<br />
2.00 pm 1257 58.6 15 0.230<br />
3.00 pm 1320 60.3 15 0.232<br />
4.00 pm 1307 61.5 15 0.232<br />
5.00 pm 1282 59.2 15 0.232<br />
6.00 pm 1257 58.3 15 0.230<br />
7.00 pm 1250 57.3 15 0.230<br />
8.00 pm 1192 54.9 15 0.225<br />
9.00 pm 1197 55.3 15 0.225<br />
10.00 pm 1243 56.4 15 0.230<br />
11.00 pm 1240 56.0 15 0.230<br />
12.00 am 1256 57.4 15 0.230<br />
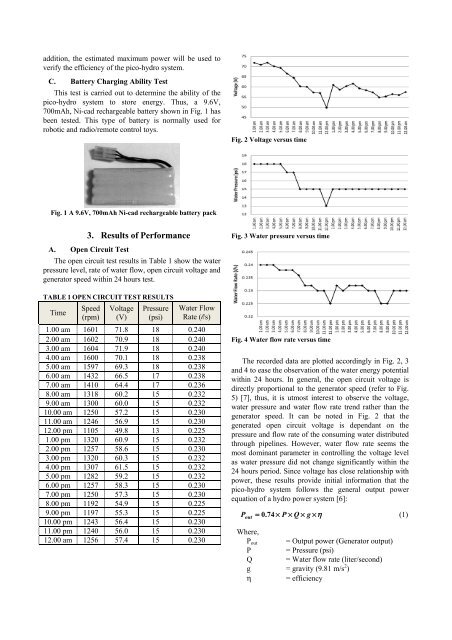
Fig. 2 Voltage versus time<br />
Fig. 3 Water pressure versus time<br />
Fig. 4 Water flow rate versus time<br />
The recorded data are plotted accordingly in Fig. 2, 3<br />
and 4 to ease <strong>the</strong> observati<strong>on</strong> <strong>of</strong> <strong>the</strong> water energy potential<br />
within 24 hours. In general, <strong>the</strong> open circuit voltage is<br />
directly proporti<strong>on</strong>al to <strong>the</strong> generator speed (refer to Fig.<br />
5) [7], thus, it is utmost interest to observe <strong>the</strong> voltage,<br />
water pressure and water flow rate trend ra<strong>the</strong>r than <strong>the</strong><br />
generator speed. It can be noted in Fig. 2 that <strong>the</strong><br />
generated open circuit voltage is dependant <strong>on</strong> <strong>the</strong><br />
pressure and flow rate <strong>of</strong> <strong>the</strong> c<strong>on</strong>suming water distributed<br />
through pipelines. However, water flow rate seems <strong>the</strong><br />
most dominant parameter in c<strong>on</strong>trolling <strong>the</strong> voltage level<br />
as water pressure did not change significantly within <strong>the</strong><br />
24 hours period. Since voltage has close relati<strong>on</strong>ship with<br />
power, <strong>the</strong>se results provide initial informati<strong>on</strong> that <strong>the</strong><br />
pico-<strong>hydro</strong> system follows <strong>the</strong> general output power<br />
equati<strong>on</strong> <strong>of</strong> a <strong>hydro</strong> power system [6]:<br />
P out<br />
= 0 . 74 × P × Q × g × η<br />
(1)<br />
Where,<br />
Pout = Output power (Generator output)<br />
P = Pressure (psi)<br />
Q = Water flow rate (liter/sec<strong>on</strong>d)<br />
g = gravity (9.81 m/s 2 )<br />
η = efficiency