

Valorization of shea caterpillar droppings (Cirina butyrospermi Vuillet) in the ecological management of soil fertility in Burkina Faso i IJAAR
Works on park lands show that shea tree is a widespread species in the fields in Burkina Faso. There are caterpillars which are rich in proteins and throw out important quantity of dejection on the soil surface. The aim of this study was to determine the amount of droppings produced by caterpillars and their chemical quality in Koumbia area. The amount of dejection was determined on small plots and expressed as amount of dry matter (DM). Chemical analyzes have focused on the major elements (C, N, P and K). Our results show an average production of 19.34 kg for an average area of 68.47 m2 under a shea tree. We also observe that the production of caterpillar droppings is a function of the shea trees density and fluctuate between 440 and 3 775 kg ha-1. The data of chemical analyzes show that caterpillar droppings have high content of carbon (477.7 g kg-1) and nitrogen (10.8 g kg-1) and low content of phosphorus (0.3 g kg-1) and potassium (0.9 g kg-1). The amounts of C and N that caterpillar droppings are likely to bring, show that they can cover between 56 and 484 % of annual loss of soil C and fully compensate exports N of major crops (cotton, maize, sorghum) of the study area. The valorization of caterpillar droppings is therefore a way of ecological management of soil fertility of shea parks. However, the C/N (44) of caterpillar droppings suggests further agronomic investigations.
Works on park lands show that shea tree is a widespread species in the fields in Burkina Faso. There are caterpillars which are rich in proteins and throw out important quantity of dejection on the soil surface. The aim of this study was to determine the amount of droppings produced by caterpillars and their chemical quality in Koumbia area. The amount of dejection was determined on small plots and expressed as amount of dry matter (DM). Chemical analyzes have focused on the major elements (C, N, P and K). Our results show an average production of 19.34 kg for an average area of 68.47 m2 under a shea tree. We also observe that the production of caterpillar droppings is a function of the shea trees density and fluctuate between 440 and 3 775 kg ha-1. The data of chemical analyzes show that caterpillar droppings have high content of carbon (477.7 g kg-1) and nitrogen (10.8 g kg-1) and low content of phosphorus (0.3 g kg-1) and potassium (0.9 g kg-1). The amounts of C and N that caterpillar droppings are likely to bring, show that they can cover between 56 and 484 % of annual loss of soil C and fully compensate exports N of major crops (cotton, maize, sorghum) of the study area. The valorization of caterpillar droppings is therefore a way of ecological management of soil fertility of shea parks. However, the C/N (44) of caterpillar droppings suggests further agronomic investigations.

You also want an ePaper? Increase the reach of your titles
YUMPU automatically turns print PDFs into web optimized ePapers that Google loves.
Int. J. Agri. Agri. R.<br />
Assessment <strong>of</strong> <strong>the</strong> economic value <strong>of</strong> manure<br />
follow<strong>in</strong>g a valorization to urea<br />
Obta<strong>in</strong><strong>in</strong>g <strong>caterpillar</strong> <strong>dropp<strong>in</strong>gs</strong> <strong>in</strong> sufficient<br />
quantities correspond<strong>in</strong>g to <strong>the</strong>ir com<strong>in</strong>g down to<br />
trees <strong>the</strong>ir collect for consumption and especially <strong>the</strong><br />
period <strong>of</strong> application <strong>of</strong> urea on crops. This leads us to<br />
make <strong>the</strong> hypo<strong>the</strong>sis that <strong>the</strong> application <strong>of</strong> <strong>caterpillar</strong><br />
manure on crops could substitute urea. To do this, we<br />
used <strong>the</strong> follow<strong>in</strong>g formula to estimate <strong>the</strong> amount <strong>of</strong><br />
urea: Urea Quantity (kg ha -1 ) = N Quantity *<br />
(100/46), N quantity correspond<strong>in</strong>g to that provided<br />
by <strong>the</strong> <strong>caterpillar</strong> <strong>dropp<strong>in</strong>gs</strong> accord<strong>in</strong>g to <strong>the</strong> type <strong>of</strong><br />
plot and 100 kg <strong>of</strong> urea conta<strong>in</strong>s 46 kg <strong>of</strong> N.<br />
The economic equivalent was obta<strong>in</strong>ed by multiply<strong>in</strong>g<br />
<strong>the</strong> amount <strong>of</strong> urea obta<strong>in</strong>ed by 326 FCFA (cost <strong>of</strong> a<br />
kg <strong>of</strong> urea as a fertilizer market<strong>in</strong>g company <strong>in</strong><br />
Burk<strong>in</strong>a <strong>Faso</strong>).<br />
Results<br />
Quantification <strong>of</strong> <strong>caterpillar</strong> <strong>dropp<strong>in</strong>gs</strong><br />
The results show that <strong>the</strong> amount <strong>of</strong> <strong>dropp<strong>in</strong>gs</strong><br />
produced under <strong>shea</strong> trees varies between 9.21 and<br />
31.26 kg with an average amount per tree <strong>of</strong><br />
19.39±7.85 kg (Table 2). This production does not<br />
move <strong>in</strong> <strong>the</strong> same order as <strong>the</strong> area under <strong>of</strong> <strong>the</strong> <strong>shea</strong><br />
tree. We note that for 53.69 m 2 area, <strong>the</strong> production is<br />
21.60 kg aga<strong>in</strong>st 14.55 kg for 100.56 m 2 area.<br />
Table 2. Quantity <strong>of</strong> <strong>dropp<strong>in</strong>gs</strong> produced by <strong>caterpillar</strong>s per <strong>shea</strong> tree.<br />
Shea 1 Shea 2 Shea 3 Shea 4 Shea 5 Shea 6 Average<br />
Crown ground surface (m 2 ) 46.91 79.88 68.53 53.69 61.25 100.56 68.47 (19.47)<br />
Drupp<strong>in</strong>gs (Kg DM plant -1 ) 9.21 31.26 24.03 21.60 15.68 14.55 19.39 (7.85)<br />
DM=Dry matter.<br />
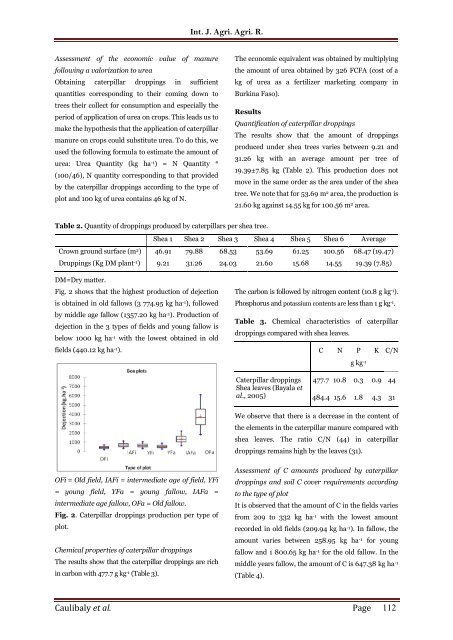
Fig. 2 shows that <strong>the</strong> highest production <strong>of</strong> dejection<br />
is obta<strong>in</strong>ed <strong>in</strong> old fallows (3 774.95 kg ha -1 ), followed<br />
by middle age fallow (1357.20 kg ha -1 ). Production <strong>of</strong><br />
dejection <strong>in</strong> <strong>the</strong> 3 types <strong>of</strong> fields and young fallow is<br />
below 1000 kg ha -1 with <strong>the</strong> lowest obta<strong>in</strong>ed <strong>in</strong> old<br />
fields (440.12 kg ha -1 ).<br />
The carbon is followed by nitrogen content (10.8 g kg -1 ).<br />
Phosphorus and potassium contents are less than 1 g kg -1 .<br />
Table 3. Chemical characteristics <strong>of</strong> <strong>caterpillar</strong><br />
<strong>dropp<strong>in</strong>gs</strong> compared with <strong>shea</strong> leaves.<br />
C N P<br />
g kg -1<br />
K C/N<br />
Caterpillar <strong>dropp<strong>in</strong>gs</strong><br />
Shea leaves (Bayala et<br />
al., 2005)<br />
477.7 10.8 0.3 0.9 44<br />
484.4 15.6 1.8 4.3 31<br />
We observe that <strong>the</strong>re is a decrease <strong>in</strong> <strong>the</strong> content <strong>of</strong><br />
<strong>the</strong> elements <strong>in</strong> <strong>the</strong> <strong>caterpillar</strong> manure compared with<br />
<strong>shea</strong> leaves. The ratio C/N (44) <strong>in</strong> <strong>caterpillar</strong><br />
<strong>dropp<strong>in</strong>gs</strong> rema<strong>in</strong>s high by <strong>the</strong> leaves (31).<br />
OFi = Old field, IAFi = <strong>in</strong>termediate age <strong>of</strong> field, YFi<br />
= young field, YFa = young fallow, IAFa =<br />
<strong>in</strong>termediate age fallow, OFa = Old fallow.<br />
Fig. 2. Caterpillar <strong>dropp<strong>in</strong>gs</strong> production per type <strong>of</strong><br />
plot.<br />
Chemical properties <strong>of</strong> <strong>caterpillar</strong> <strong>dropp<strong>in</strong>gs</strong><br />
The results show that <strong>the</strong> <strong>caterpillar</strong> <strong>dropp<strong>in</strong>gs</strong> are rich<br />
<strong>in</strong> carbon with 477.7 g kg -1 (Table 3).<br />
Assessment <strong>of</strong> C amounts produced by <strong>caterpillar</strong><br />
<strong>dropp<strong>in</strong>gs</strong> and <strong>soil</strong> C cover requirements accord<strong>in</strong>g<br />
to <strong>the</strong> type <strong>of</strong> plot<br />
It is observed that <strong>the</strong> amount <strong>of</strong> C <strong>in</strong> <strong>the</strong> fields varies<br />
from 209 to 332 kg ha -1 with <strong>the</strong> lowest amount<br />
recorded <strong>in</strong> old fields (209.94 kg ha -1 ). In fallow, <strong>the</strong><br />
amount varies between 258.95 kg ha -1 for young<br />
fallow and 1 800.65 kg ha -1 for <strong>the</strong> old fallow. In <strong>the</strong><br />
middle years fallow, <strong>the</strong> amount <strong>of</strong> C is 647.38 kg ha -1<br />
(Table 4).<br />
Caulibaly et al. Page 112


