

2 Trade Finance & Investments PLC • Annual Report 2015/16
1102_1476931959
1102_1476931959

Create successful ePaper yourself
Turn your PDF publications into a flip-book with our unique Google optimized e-Paper software.
<strong>Annual</strong> <strong>Report</strong> <strong>2015</strong>/<strong>16</strong> <strong>•</strong> <strong>Trade</strong> <strong>Finance</strong> & <strong>Investments</strong> <strong>PLC</strong> 113<br />
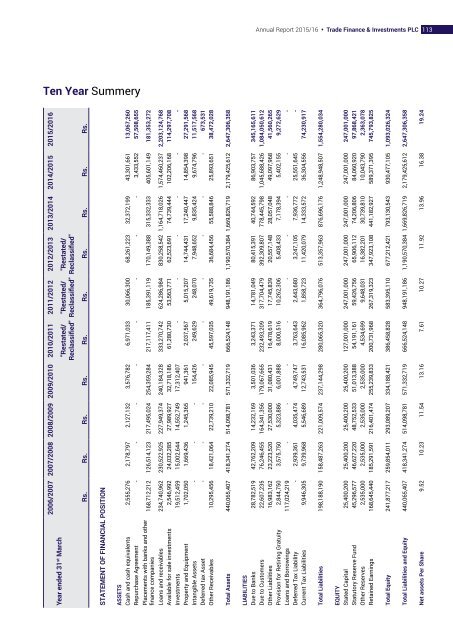
Ten Year Summery<br />
Year ended 31 st March<br />
2006/2007 2007/2008 2008/2009 2009/2010 2010/2011 2011/2012 2012/2013 2013/2014 2014/<strong>2015</strong> <strong>2015</strong>/20<strong>16</strong><br />
"Restated/<br />
Reclassified"<br />
"Restated/<br />
Reclassified"<br />
"Restated/<br />
Reclassified"<br />
Rs. Rs. Rs. Rs. Rs. Rs. Rs. Rs. Rs. Rs.<br />
STATEMENT OF FINANCIAL POSITION<br />
ASSETS<br />
Cash and cash equivalents 2,555,276 2,178,797 2,127,132 3,576,782 6,971,033 30,066,300 68,261,223 32,372,199 43,301,661 13,067,260<br />
Repurchase Agreement - - - - - - - - 3,433,552 57,508,655<br />
Placements with banks and other<br />
finance companies<br />
<strong>16</strong>8,712,212 126,514,123 217,495,024 254,359,284 217,117,411 185,391,119 170,149,388 315,332,333 405,601,149 181,353,272<br />
Loans and receivables 234,740,962 230,522,925 227,949,374 240,184,328 333,270,742 624,286,984 830,258,542 1,<strong>16</strong>4,718,026 1,574,460,237 2,203,124,768<br />
Available for sale investments 2,546,992 24,032,285 27,989,927 32,718,186 61,280,730 53,563,771 62,523,691 74,739,444 102,206,<strong>16</strong>8 114,297,708<br />
<strong>Investments</strong> 19,512,459 15,002,644 14,552,749 17,312,407 - - - - - -<br />
Property and Equipment 1,702,050 1,669,436 1,245,365 941,361 2,037,567 5,015,207 14,744,431 17,240,447 14,854,398 27,291,568<br />
Intangible Assets - - - 154,426 249,629 248,070 7,948,652 9,835,424 9,674,796 11,517,568<br />
Deferred tax Asset - - - - - - - - - 673,531<br />
Other Receivables 10,295,456 18,421,064 22,739,210 22,085,945 45,597,035 49,619,735 36,684,456 55,588,846 25,893,651 38,472,028<br />
Total Assets 440,065,407 418,341,274 514,098,781 571,332,719 666,524,148 948,191,186 1,190,570,384 1,669,826,719 2,179,425,612 2,647,306,358<br />
LIABILITIES<br />
Due to Banks 28,782,519 42,762,209 14,232,<strong>16</strong>9 3,501,036 3,243,371 14,781,049 80,415,391 40,744,592 86,903,757 345,<strong>16</strong>5,611<br />
Due to Customers 22,607,235 76,246,455 <strong>16</strong>4,341,356 179,067,665 232,493,209 317,704,479 392,309,807 778,445,798 1,045,688,426 1,084,050,612<br />
Other Liabilities <strong>16</strong>,983,<strong>16</strong>2 23,223,520 27,530,000 31,080,431 <strong>16</strong>,478,619 17,745,839 20,557,148 28,057,048 49,097,968 41,560,265<br />
Provision for Retiring Gratuity 2,844,750 3,575,750 5,323,886 6,001,888 8,000,5<strong>16</strong> 10,262,306 5,408,433 7,178,394 5,402,155 9,272,629<br />
Loans and Borrowings 117,024,219 - - - - - - - - -<br />
Deferred Tax Liability - 2,939,361 4,035,474 4,749,747 3,763,643 2,443,680 3,247,105 7,936,772 25,551,645 -<br />
Current Tax Liabilities 9,946,305 9,739,968 5,546,689 12,743,531 <strong>16</strong>,085,962 1,858,723 11,420,079 14,333,572 36,304,556 74,230,917<br />
Total Liabilities 198,188,190 158,487,263 221,009,574 237,144,298 280,065,320 364,796,076 513,357,963 876,696,176 1,248,948,507 1,554,280,034<br />
EQUITY<br />
Stated Capital 25,400,200 25,400,200 25,400,200 25,400,200 127,001,000 247,001,000 247,001,000 247,001,000 247,001,000 247,001,000<br />
Statutory Reserve Fund 45,296,577 46,627,220 48,752,533 51,013,388 54,191,<strong>16</strong>1 59,426,756 65,906,112 74,206,806 84,060,920 97,868,421<br />
Other Reserves 2,535,000 2,535,000 2,535,000 2,535,000 4,534,699 9,648,031 <strong>16</strong>,382,201 30,739,810 10,043,790 2,363,078<br />
Retained Earnings <strong>16</strong>8,645,440 185,291,591 2<strong>16</strong>,401,474 255,239,833 200,731,968 267,319,323 347,923,108 441,182,927 589,371,395 745,793,825<br />
Total Equity 241,877,217 259,854,011 293,089,207 334,188,421 386,458,828 583,395,110 677,212,421 793,130,543 930,477,105 1,093,026,324<br />
Total Liabilities and Equity 440,065,407 418,341,274 514,098,781 571,332,719 666,524,148 948,191,186 1,190,570,384 1,669,826,719 2,179,425,612 2,647,306,358<br />
Net assets Per Share 9.52 10.23 11.54 13.<strong>16</strong> 7.61 10.27 11.92 13.96 <strong>16</strong>.38 19.24