PSYCH 625 Week 5 Individual Assignment

You also want an ePaper? Increase the reach of your titles
YUMPU automatically turns print PDFs into web optimized ePapers that Google loves.
14<br />
11<br />
18<br />
9<br />
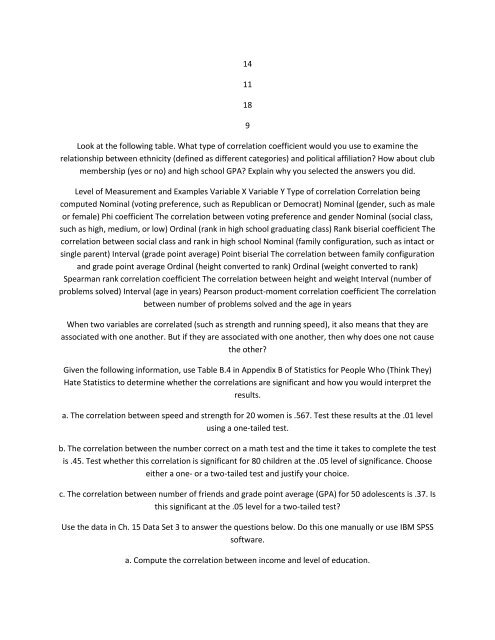
Look at the following table. What type of correlation coefficient would you use to examine the<br />
relationship between ethnicity (defined as different categories) and political affiliation? How about club<br />
membership (yes or no) and high school GPA? Explain why you selected the answers you did.<br />
Level of Measurement and Examples Variable X Variable Y Type of correlation Correlation being<br />
computed Nominal (voting preference, such as Republican or Democrat) Nominal (gender, such as male<br />
or female) Phi coefficient The correlation between voting preference and gender Nominal (social class,<br />
such as high, medium, or low) Ordinal (rank in high school graduating class) Rank biserial coefficient The<br />
correlation between social class and rank in high school Nominal (family configuration, such as intact or<br />
single parent) Interval (grade point average) Point biserial The correlation between family configuration<br />
and grade point average Ordinal (height converted to rank) Ordinal (weight converted to rank)<br />
Spearman rank correlation coefficient The correlation between height and weight Interval (number of<br />
problems solved) Interval (age in years) Pearson product-moment correlation coefficient The correlation<br />
between number of problems solved and the age in years<br />
When two variables are correlated (such as strength and running speed), it also means that they are<br />
associated with one another. But if they are associated with one another, then why does one not cause<br />
the other?<br />
Given the following information, use Table B.4 in Appendix B of Statistics for People Who (Think They)<br />
Hate Statistics to determine whether the correlations are significant and how you would interpret the<br />
results.<br />
a. The correlation between speed and strength for 20 women is .567. Test these results at the .01 level<br />
using a one-tailed test.<br />
b. The correlation between the number correct on a math test and the time it takes to complete the test<br />
is .45. Test whether this correlation is significant for 80 children at the .05 level of significance. Choose<br />
either a one- or a two-tailed test and justify your choice.<br />
c. The correlation between number of friends and grade point average (GPA) for 50 adolescents is .37. Is<br />
this significant at the .05 level for a two-tailed test?<br />
Use the data in Ch. 15 Data Set 3 to answer the questions below. Do this one manually or use IBM SPSS<br />
software.<br />
a. Compute the correlation between income and level of education.