Ecosystem Services Assessment of North Ari Atoll Maldives
2lV0IPE
2lV0IPE
Create successful ePaper yourself
Turn your PDF publications into a flip-book with our unique Google optimized e-Paper software.
Reef fishing 25,965 16,892<br />
Total 1,113,224 51,129<br />
It must be noted that the values expressed here are not uniform across the reef system, and<br />
some coral reefs will provide more ecosystem services and will be more valuable for the<br />
economy than others (see figure 5 for concentrations <strong>of</strong> ecosystem services). The value <strong>of</strong> a<br />
reef will depend on its ecological condition and productivity, perceived importance by<br />
different sectors, and actual use by the stakeholders.<br />
5.2 Comparative financial analysis<br />
The comparative financial analysis outlined below uses net present value (NPV)<br />
calculations. NPV is based on the time value <strong>of</strong> money concept. This is that money<br />
available in the present is worth more than money available in the future, as money available<br />
in the present can be invested and earn interest, whereas the future purchasing power <strong>of</strong><br />
money will be eroded due to the effects <strong>of</strong> inflation. NPV calculations convert the difference<br />
between a projected stream <strong>of</strong> future benefits and costs into the equivalent <strong>of</strong> the present<br />
value <strong>of</strong> these amounts, by using a discount rate. Discounting is thus needed to express<br />
future costs or benefits at today’s equivalent value, and though mechanically easy, no<br />
agreement exists on the correct discount rate to be used in all cases.<br />
Market rates (rates <strong>of</strong> return on capital) that reflect social preferences constitute appropriate<br />
discount rates, but these can range from 1% to 10% or more, in real terms versus nominal<br />
terms which are higher and adjusted for annual inflation, depending on whether the rate <strong>of</strong><br />
return is from the public domain (e.g. a treasury bond) or the private domain (e.g. the return<br />
on a private investment). NPV analysis is typically based on a desired rate <strong>of</strong> return by<br />
investors (which is the discount rate used), but in the case <strong>of</strong> assessing investments for<br />
conservation it is more common to use several different discount rates to demonstrate the<br />
impact, or sensitivity, that the choice <strong>of</strong> discount rate has on the financial valuation.<br />
Therefore, while environmental discount rates are typically around 7-8%, for our comparative<br />
analyses we use two values above and below those values: 6% and 13% in nominal terms,<br />
respectively. These discount rates are based on the returns that treasury bills currently yield<br />
<strong>of</strong> 4.6% and the marginal rate <strong>of</strong> return on investments <strong>of</strong> 12% in the <strong>Maldives</strong>. These rates<br />
are both adjusted by the consumer price index (CPI) <strong>of</strong> 1.1%, which is a proxy for annual<br />
inflation, and then rounded to the nearest whole number.<br />
If the NPV is positive this indicates that the investment involved is worthwhile, whereas a<br />
negative value indicates the opposite. In general terms, a higher discount rate is associated<br />
with high-consumption and/or rapidly growing economies, or with the higher risks and<br />
shorter-time preferences that tend to prevail in developing economies. The use <strong>of</strong> a higher<br />
discount rate results in a lower NPV.<br />
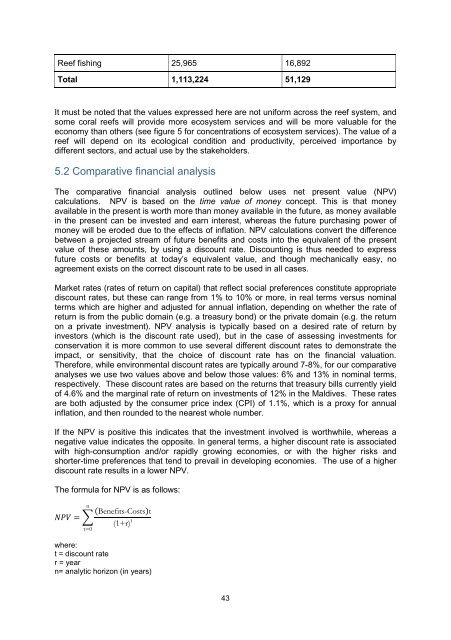
The formula for NPV is as follows:<br />
n<br />
NNNNNN = (Benefits-Costs)t<br />
(1+r) t<br />
t=0<br />
where:<br />
t = discount rate<br />
r = year<br />
n= analytic horizon (in years)<br />
43


