compressed.tracemonkey-pldi-09

You also want an ePaper? Increase the reach of your titles
YUMPU automatically turns print PDFs into web optimized ePapers that Google loves.
Hence, recording and compiling a trace speculates that the path and<br />
typing will be exactly as they were during recording for subsequent<br />
iterations of the loop.<br />
Every compiled trace contains all the guards (checks) required<br />
to validate the speculation. If one of the guards fails (if control<br />
flow is different, or a value of a different type is generated), the<br />
trace exits. If an exit becomes hot, the VM can record a branch<br />
trace starting at the exit to cover the new path. In this way, the VM<br />
records a trace tree covering all the hot paths through the loop.<br />
Nested loops can be difficult to optimize for tracing VMs. In<br />
a naïve implementation, inner loops would become hot first, and<br />
the VM would start tracing there. When the inner loop exits, the<br />
VM would detect that a different branch was taken. The VM would<br />
try to record a branch trace, and find that the trace reaches not the<br />
inner loop header, but the outer loop header. At this point, the VM<br />
could continue tracing until it reaches the inner loop header again,<br />
thus tracing the outer loop inside a trace tree for the inner loop.<br />
But this requires tracing a copy of the outer loop for every side exit<br />
and type combination in the inner loop. In essence, this is a form<br />
of unintended tail duplication, which can easily overflow the code<br />
cache. Alternatively, the VM could simply stop tracing, and give up<br />
on ever tracing outer loops.<br />
We solve the nested loop problem by recording nested trace<br />
trees. Our system traces the inner loop exactly as the naïve version.<br />
The system stops extending the inner tree when it reaches an outer<br />
loop, but then it starts a new trace at the outer loop header. When<br />
the outer loop reaches the inner loop header, the system tries to call<br />
the trace tree for the inner loop. If the call succeeds, the VM records<br />
the call to the inner tree as part of the outer trace and finishes<br />
the outer trace as normal. In this way, our system can trace any<br />
number of loops nested to any depth without causing excessive tail<br />
duplication.<br />
These techniques allow a VM to dynamically translate a program<br />
to nested, type-specialized trace trees. Because traces can<br />
cross function call boundaries, our techniques also achieve the effects<br />
of inlining. Because traces have no internal control-flow joins,<br />
they can be optimized in linear time by a simple compiler (10).<br />
Thus, our tracing VM efficiently performs the same kind of optimizations<br />
that would require interprocedural analysis in a static<br />
optimization setting. This makes tracing an attractive and effective<br />
tool to type specialize even complex function call-rich code.<br />
We implemented these techniques for an existing JavaScript interpreter,<br />
SpiderMonkey. We call the resulting tracing VM Trace-<br />
Monkey. TraceMonkey supports all the JavaScript features of SpiderMonkey,<br />
with a 2x-20x speedup for traceable programs.<br />
This paper makes the following contributions:<br />
• We explain an algorithm for dynamically forming trace trees to<br />
cover a program, representing nested loops as nested trace trees.<br />
• We explain how to speculatively generate efficient type-specialized<br />
code for traces from dynamic language programs.<br />
• We validate our tracing techniques in an implementation based<br />
on the SpiderMonkey JavaScript interpreter, achieving 2x-20x<br />
speedups on many programs.<br />
The remainder of this paper is organized as follows. Section 3 is<br />
a general overview of trace tree based compilation we use to capture<br />
and compile frequently executed code regions. In Section 4<br />
we describe our approach of covering nested loops using a number<br />
of individual trace trees. In Section 5 we describe our tracecompilation<br />
based speculative type specialization approach we use<br />
to generate efficient machine code from recorded bytecode traces.<br />
Our implementation of a dynamic type-specializing compiler for<br />
JavaScript is described in Section 6. Related work is discussed in<br />
Section 8. In Section 7 we evaluate our dynamic compiler based on<br />
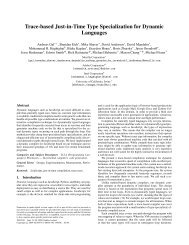
1 for (var i = 2; i < 100; ++i) {<br />
2 if (!primes[i])<br />
3 continue;<br />
4 for (var k = i + i; i < 100; k += i)<br />
5 primes[k] = false;<br />
6 }<br />
Figure 1. Sample program: sieve of Eratosthenes. primes is<br />
initialized to an array of 100 false values on entry to this code<br />
snippet.<br />
abort<br />
recording<br />
Record<br />
LIR Trace<br />
Compile<br />
LIR Trace<br />
finish at<br />
loop header<br />
hot<br />
loop/exit<br />
Interpret<br />
Bytecodes<br />
loop<br />
edge<br />
Monitor<br />
cold/blacklisted<br />
loop/exit<br />
loop edge with<br />
same types<br />
side exit,<br />
no existing trace<br />
compiled trace<br />
ready<br />
Enter<br />
Compiled Trace<br />
Execute<br />
Compiled Trace<br />
Leave<br />
Compiled Trace<br />
Symbol Key<br />
Overhead<br />
Interpreting<br />
Native<br />
side exit to<br />
existing trace<br />
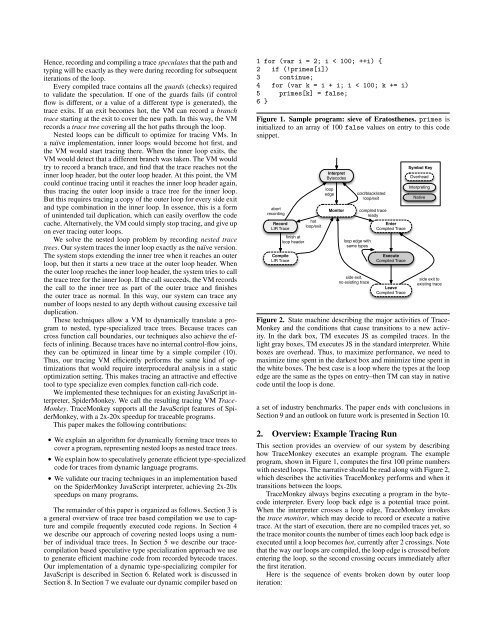
Figure 2. State machine describing the major activities of Trace-<br />
Monkey and the conditions that cause transitions to a new activity.<br />
In the dark box, TM executes JS as compiled traces. In the<br />
light gray boxes, TM executes JS in the standard interpreter. White<br />
boxes are overhead. Thus, to maximize performance, we need to<br />
maximize time spent in the darkest box and minimize time spent in<br />
the white boxes. The best case is a loop where the types at the loop<br />
edge are the same as the types on entry–then TM can stay in native<br />
code until the loop is done.<br />
a set of industry benchmarks. The paper ends with conclusions in<br />
Section 9 and an outlook on future work is presented in Section 10.<br />
2. Overview: Example Tracing Run<br />
This section provides an overview of our system by describing<br />
how TraceMonkey executes an example program. The example<br />
program, shown in Figure 1, computes the first 100 prime numbers<br />
with nested loops. The narrative should be read along with Figure 2,<br />
which describes the activities TraceMonkey performs and when it<br />
transitions between the loops.<br />
TraceMonkey always begins executing a program in the bytecode<br />
interpreter. Every loop back edge is a potential trace point.<br />
When the interpreter crosses a loop edge, TraceMonkey invokes<br />
the trace monitor, which may decide to record or execute a native<br />
trace. At the start of execution, there are no compiled traces yet, so<br />
the trace monitor counts the number of times each loop back edge is<br />
executed until a loop becomes hot, currently after 2 crossings. Note<br />
that the way our loops are compiled, the loop edge is crossed before<br />
entering the loop, so the second crossing occurs immediately after<br />
the first iteration.<br />
Here is the sequence of events broken down by outer loop<br />
iteration: