

Destination Known
2nIe2aC
2nIe2aC

Create successful ePaper yourself
Turn your PDF publications into a flip-book with our unique Google optimized e-Paper software.
The Power of the 9th Grade Cohort<br />
All of the recommended measures in<br />
the Accountability Workgroup report<br />
begin with the “percentage of the 9 th<br />
grade cohort.” This may seem like trivial<br />
language, but it is actually one of the<br />
most powerful actions a state can take to<br />
provide an accurate accounting of student<br />
preparation for college and careers. As<br />
mentioned previously, for too long the<br />
reporting of education data has contributed<br />
to misperceptions among the public<br />
about students’ readiness for life beyond<br />
high school. Current state reporting of<br />
college and career readiness measures is<br />
inconsistent, across measures and states. It<br />
is regular practice in states to use multiple<br />
different denominators when calculating<br />
performance. For instance, a state may<br />
use only test takers (usually 11 th graders)<br />
for calculating assessment proficiency,<br />
12 th grade students for calculating AP<br />
exam success, and high school graduates<br />
for calculating the percent of students<br />
that completed a career pathway. There<br />
is nothing inherently wrong with this<br />
approach, it simply makes it more difficult<br />
for parents and policymakers to have a<br />
consistent view of student preparation.<br />
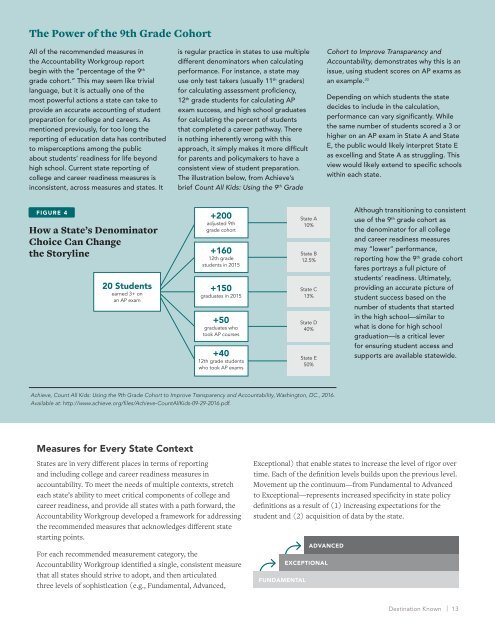
The illustration below, from Achieve’s<br />
brief Count All Kids: Using the 9 th Grade<br />
Cohort to Improve Transparency and<br />
Accountability, demonstrates why this is an<br />
issue, using student scores on AP exams as<br />
an example. 30<br />
Depending on which students the state<br />
decides to include in the calculation,<br />
performance can vary significantly. While<br />
the same number of students scored a 3 or<br />
higher on an AP exam in State A and State<br />
E, the public would likely interpret State E<br />
as excelling and State A as struggling. This<br />
view would likely extend to specific schools<br />
within each state.<br />
FIGURE 44<br />
How a State’s Denominator<br />
Choice Can Change<br />
the Storyline<br />
20 Students<br />
earned 3+ on<br />
an AP exam<br />
+200<br />
adjusted 9th<br />
grade cohort<br />
+160<br />
12th grade<br />
students in 2015<br />
+150<br />
graduates in 2015<br />
+50<br />
graduates who<br />
took AP courses<br />
+40<br />
12th grade students<br />
who took AP exams<br />
State A<br />
10%<br />
State B<br />
12.5%<br />
State C<br />
13%<br />
State D<br />
40%<br />
State E<br />
50%<br />
Although transitioning to consistent<br />
use of the 9 th grade cohort as<br />
the denominator for all college<br />
and career readiness measures<br />
may “lower” performance,<br />
reporting how the 9 th grade cohort<br />
fares portrays a full picture of<br />
students’ readiness. Ultimately,<br />
providing an accurate picture of<br />
student success based on the<br />
number of students that started<br />
in the high school—similar to<br />
what is done for high school<br />
graduation—is a critical lever<br />
for ensuring student access and<br />
supports are available statewide.<br />
Achieve, Count All All Kids: Kids: Using Using the the 9th Grade 9th Grade Cohort Cohort to Improve to Improve Transparency Transparency and Accountability, and Accountability, Washington, Washington, DC., 2016. DC., 2016.<br />
Available at: at: http://www.achieve.org/files/Achieve-CountAllKids-09-29-2016.pdf.<br />
Measures for Every State Context<br />
States are in very different places in terms of reporting<br />
and including college and career readiness measures in<br />
accountability. To meet the needs of multiple contexts, stretch<br />
each state’s ability to meet critical components of college and<br />
career readiness, and provide all states with a path forward, the<br />
Accountability Workgroup developed a framework for addressing<br />
the recommended measures that acknowledges different state<br />
starting points.<br />
For each recommended measurement category, the<br />
Accountability Workgroup identified a single, consistent measure<br />
that all states should strive to adopt, and then articulated<br />
three levels of sophistication (e.g., Fundamental, Advanced,<br />
Exceptional) that enable states to increase the level of rigor over<br />
time. Each of the definition levels builds upon the previous level.<br />
Movement up the continuum—from Fundamental to Advanced<br />
to Exceptional—represents increased specificity in state policy<br />
definitions as a result of (1) increasing expectations for the<br />
student and (2) acquisition of data by the state.<br />
FUNDAMENTAL<br />
ADVANCED<br />
EXCEPTIONAL<br />
<strong>Destination</strong> <strong>Known</strong> | 13