Erythritol-Industry-2017-Market-Research-Report

Create successful ePaper yourself
Turn your PDF publications into a flip-book with our unique Google optimized e-Paper software.
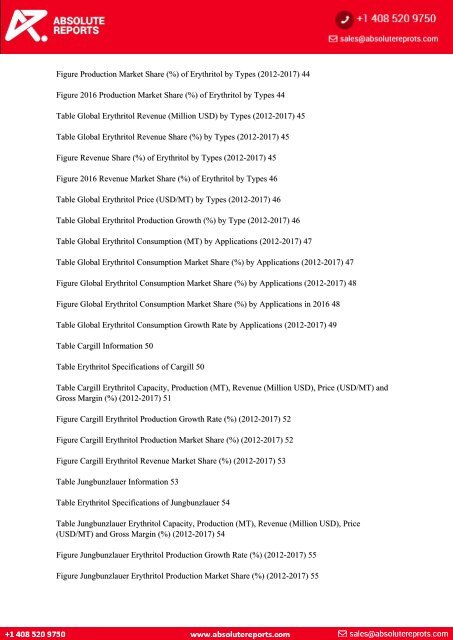
Figure Production <strong>Market</strong> Share (%) of <strong>Erythritol</strong> by Types (2012-<strong>2017</strong>) 44<br />
Figure 2016 Production <strong>Market</strong> Share (%) of <strong>Erythritol</strong> by Types 44<br />
Table Global <strong>Erythritol</strong> Revenue (Million USD) by Types (2012-<strong>2017</strong>) 45<br />
Table Global <strong>Erythritol</strong> Revenue Share (%) by Types (2012-<strong>2017</strong>) 45<br />
Figure Revenue Share (%) of <strong>Erythritol</strong> by Types (2012-<strong>2017</strong>) 45<br />
Figure 2016 Revenue <strong>Market</strong> Share (%) of <strong>Erythritol</strong> by Types 46<br />
Table Global <strong>Erythritol</strong> Price (USD/MT) by Types (2012-<strong>2017</strong>) 46<br />
Table Global <strong>Erythritol</strong> Production Growth (%) by Type (2012-<strong>2017</strong>) 46<br />
Table Global <strong>Erythritol</strong> Consumption (MT) by Applications (2012-<strong>2017</strong>) 47<br />
Table Global <strong>Erythritol</strong> Consumption <strong>Market</strong> Share (%) by Applications (2012-<strong>2017</strong>) 47<br />
Figure Global <strong>Erythritol</strong> Consumption <strong>Market</strong> Share (%) by Applications (2012-<strong>2017</strong>) 48<br />
Figure Global <strong>Erythritol</strong> Consumption <strong>Market</strong> Share (%) by Applications in 2016 48<br />
Table Global <strong>Erythritol</strong> Consumption Growth Rate by Applications (2012-<strong>2017</strong>) 49<br />
Table Cargill Information 50<br />
Table <strong>Erythritol</strong> Specifications of Cargill 50<br />
Table Cargill <strong>Erythritol</strong> Capacity, Production (MT), Revenue (Million USD), Price (USD/MT) and<br />
Gross Margin (%) (2012-<strong>2017</strong>) 51<br />
Figure Cargill <strong>Erythritol</strong> Production Growth Rate (%) (2012-<strong>2017</strong>) 52<br />
Figure Cargill <strong>Erythritol</strong> Production <strong>Market</strong> Share (%) (2012-<strong>2017</strong>) 52<br />
Figure Cargill <strong>Erythritol</strong> Revenue <strong>Market</strong> Share (%) (2012-<strong>2017</strong>) 53<br />
Table Jungbunzlauer Information 53<br />
Table <strong>Erythritol</strong> Specifications of Jungbunzlauer 54<br />
Table Jungbunzlauer <strong>Erythritol</strong> Capacity, Production (MT), Revenue (Million USD), Price<br />
(USD/MT) and Gross Margin (%) (2012-<strong>2017</strong>) 54<br />
Figure Jungbunzlauer <strong>Erythritol</strong> Production Growth Rate (%) (2012-<strong>2017</strong>) 55<br />
Figure Jungbunzlauer <strong>Erythritol</strong> Production <strong>Market</strong> Share (%) (2012-<strong>2017</strong>) 55