

TRAVEL & TOURISM ECONOMIC IMPACT 2017 ITALY
italy2017
italy2017

Create successful ePaper yourself
Turn your PDF publications into a flip-book with our unique Google optimized e-Paper software.
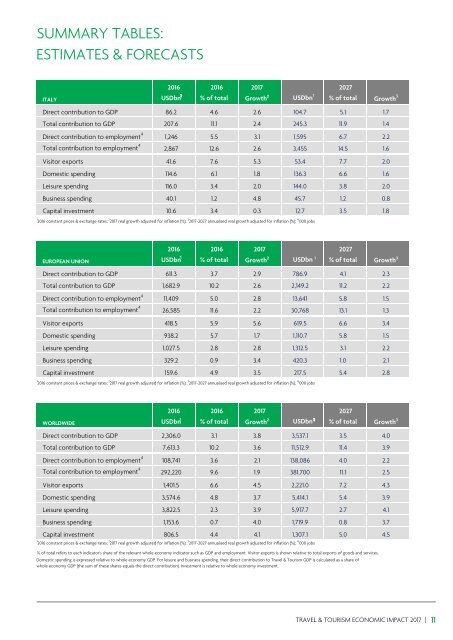
SUMMARY TABLES:<br />
ESTIMATES & FORECASTS<br />
2016 2016 <strong>2017</strong><br />
2027<br />
<strong>ITALY</strong><br />
1<br />
USDbn % of total Growth 2 1<br />
USDbn % of total Growth 3<br />
Direct contribution to GDP 86.2 4.6 2.6 104.7 5.1 1.7<br />
Total contribution to GDP 207.6 11.1 2.4 245.3 11.9 1.4<br />
Direct contribution to employment 4 1,246 5.5 3.1 1,595 6.7 2.2<br />
Total contribution to employment 4 2,867 12.6 2.6 3,455 14.5 1.6<br />
Visitor exports 41.6 7.6 5.3 53.4 7.7 2.0<br />
Domestic spending 114.6 6.1 1.8 136.3 6.6 1.6<br />
Leisure spending 116.0 3.4 2.0 144.0 3.8 2.0<br />
Business spending 40.1 1.2 4.8 45.7 1.2 0.8<br />
Capital investment 10.6 3.4 0.3 12.7 3.5 1.8<br />
1 2016 constant prices & exchange rates; 2 <strong>2017</strong> real growth adjusted for inflation (%); 3 <strong>2017</strong>-2027 annualised real growth adjusted for inflation (%); 4 '000 jobs<br />
2016 2016 <strong>2017</strong> 2027<br />
EUROPEAN UNION<br />
1<br />
USDbn % of total Growth 2 1<br />
USDbn % of total Growth 3<br />
Direct contribution to GDP 611.3 3.7 2.9 786.9 4.1 2.3<br />
Total contribution to GDP 1,682.9 10.2 2.6 2,149.2 11.2 2.2<br />
Direct contribution to employment 4 11,409 5.0 2.8 13,641 5.8 1.5<br />
Total contribution to employment 4 26,585 11.6 2.2 30,768 13.1 1.3<br />
Visitor exports 418.5 5.9 5.6 619.5 6.6 3.4<br />
Domestic spending 938.2 5.7 1.7 1,110.7 5.8 1.5<br />
Leisure spending 1,027.5 2.8 2.8 1,312.5 3.1 2.2<br />
Business spending 329.2 0.9 3.4 420.3 1.0 2.1<br />
Capital investment 159.6 4.9 3.5 217.5 5.4 2.8<br />
1 2016 constant prices & exchange rates; 2 <strong>2017</strong> real growth adjusted for inflation (%); 3 <strong>2017</strong>-2027 annualised real growth adjusted for inflation (%); 4 '000 jobs<br />
2016 2016 <strong>2017</strong> 2027<br />
1<br />
WORLDWIDE USDbn % of total Growth 2 1<br />
USDbn % of total Growth 3<br />
Direct contribution to GDP 2,306.0 3.1 3.8 3,537.1 3.5 4.0<br />
Total contribution to GDP 7,613.3 10.2 3.6 11,512.9 11.4 3.9<br />
Direct contribution to employment 4 108,741 3.6 2.1 138,086 4.0 2.2<br />
Total contribution to employment 4 292,220 9.6 1.9 381,700 11.1 2.5<br />
Visitor exports 1,401.5 6.6 4.5 2,221.0 7.2 4.3<br />
Domestic spending 3,574.6 4.8 3.7 5,414.1 5.4 3.9<br />
Leisure spending 3,822.5 2.3 3.9 5,917.7 2.7 4.1<br />
Business spending 1,153.6 0.7 4.0 1,719.9 0.8 3.7<br />
Capital investment 806.5 4.4 4.1 1,307.1 5.0 4.5<br />
1 2016 constant prices & exchange rates; 2 <strong>2017</strong> real growth adjusted for inflation (%); 3 <strong>2017</strong>-2027 annualised real growth adjusted for inflation (%); 4 '000 jobs<br />
% of total refers to each indicator's share of the relevant whole economy indicator such as GDP and employment. Visitor exports is shown relative to total exports of goods and services.<br />
Domestic spending is expressed relative to whole economy GDP. For leisure and business spending, their direct contribution to Travel & Tourism GDP is calculated as a share of<br />
whole economy GDP (the sum of these shares equals the direct contribution). Investment is relative to whole economy investment.<br />
<strong>TRAVEL</strong> & <strong>TOURISM</strong> <strong>ECONOMIC</strong> <strong>IMPACT</strong> <strong>2017</strong> | 11