

natural history of ashkenazi intelligence - Henry C Harpending ...
natural history of ashkenazi intelligence - Henry C Harpending ...
natural history of ashkenazi intelligence - Henry C Harpending ...

You also want an ePaper? Increase the reach of your titles
YUMPU automatically turns print PDFs into web optimized ePapers that Google loves.
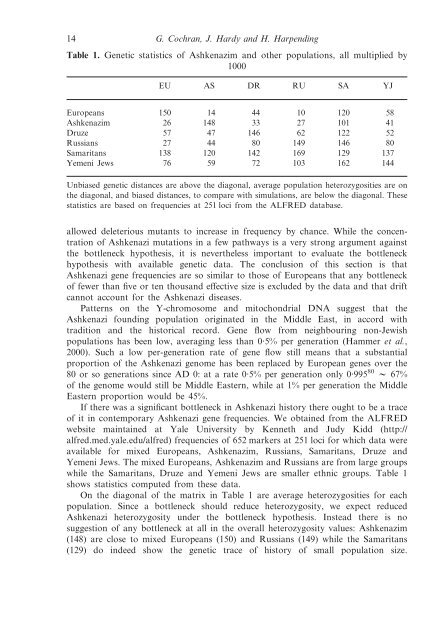
14 G. Cochran, J. Hardy and H. <strong>Harpending</strong><br />
Table 1. Genetic statistics <strong>of</strong> Ashkenazim and other populations, all multiplied by<br />
1000<br />
EU AS DR RU SA YJ<br />
Europeans 150 14 44 10 120 58<br />
Ashkenazim 26 148 33 27 101 41<br />
Druze 57 47 146 62 122 52<br />
Russians 27 44 80 149 146 80<br />
Samaritans 138 120 142 169 129 137<br />
Yemeni Jews 76 59 72 103 162 144<br />
Unbiased genetic distances are above the diagonal, average population heterozygosities are on<br />
the diagonal, and biased distances, to compare with simulations, are below the diagonal. These<br />
statistics are based on frequencies at 251 loci from the ALFRED database.<br />
allowed deleterious mutants to increase in frequency by chance. While the concentration<br />
<strong>of</strong> Ashkenazi mutations in a few pathways is a very strong argument against<br />
the bottleneck hypothesis, it is nevertheless important to evaluate the bottleneck<br />
hypothesis with available genetic data. The conclusion <strong>of</strong> this section is that<br />
Ashkenazi gene frequencies are so similar to those <strong>of</strong> Europeans that any bottleneck<br />
<strong>of</strong> fewer than five or ten thousand effective size is excluded by the data and that drift<br />
cannot account for the Ashkenazi diseases.<br />
Patterns on the Y-chromosome and mitochondrial DNA suggest that the<br />
Ashkenazi founding population originated in the Middle East, in accord with<br />
tradition and the historical record. Gene flow from neighbouring non-Jewish<br />
populations has been low, averaging less than 0·5% per generation (Hammer et al.,<br />
2000). Such a low per-generation rate <strong>of</strong> gene flow still means that a substantial<br />
proportion <strong>of</strong> the Ashkenazi genome has been replaced by European genes over the<br />
80 or so generations since AD 0: at a rate 0·5% per generation only 0·995 80 w 67%<br />
<strong>of</strong> the genome would still be Middle Eastern, while at 1% per generation the Middle<br />
Eastern proportion would be 45%.<br />
If there was a significant bottleneck in Ashkenazi <strong>history</strong> there ought to be a trace<br />
<strong>of</strong> it in contemporary Ashkenazi gene frequencies. We obtained from the ALFRED<br />
website maintained at Yale University by Kenneth and Judy Kidd (http://<br />
alfred.med.yale.edu/alfred) frequencies <strong>of</strong> 652 markers at 251 loci for which data were<br />
available for mixed Europeans, Ashkenazim, Russians, Samaritans, Druze and<br />
Yemeni Jews. The mixed Europeans, Ashkenazim and Russians are from large groups<br />
while the Samaritans, Druze and Yemeni Jews are smaller ethnic groups. Table 1<br />
shows statistics computed from these data.<br />
On the diagonal <strong>of</strong> the matrix in Table 1 are average heterozygosities for each<br />
population. Since a bottleneck should reduce heterozygosity, we expect reduced<br />
Ashkenazi heterozygosity under the bottleneck hypothesis. Instead there is no<br />
suggestion <strong>of</strong> any bottleneck at all in the overall heterozygosity values: Ashkenazim<br />
(148) are close to mixed Europeans (150) and Russians (149) while the Samaritans<br />
(129) do indeed show the genetic trace <strong>of</strong> <strong>history</strong> <strong>of</strong> small population size.