

LabEx

You also want an ePaper? Increase the reach of your titles
YUMPU automatically turns print PDFs into web optimized ePapers that Google loves.
This exercise enables me to explore some of basic functions of ArcGIS. It introduces ArcCatalog<br />
applications by creating a new personal geodatabase and a feature dataset, and importing a feature<br />
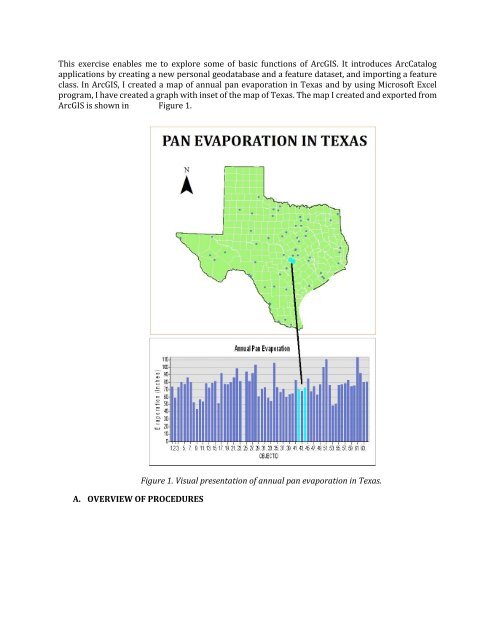
class. In ArcGIS, I created a map of annual pan evaporation in Texas and by using Microsoft Excel<br />
program, I have created a graph with inset of the map of Texas. The map I created and exported from<br />
ArcGIS is shown in Figure 1.<br />
A. OVERVIEW OF PROCEDURES<br />
Figure 1. Visual presentation of annual pan evaporation in Texas.
Figure 2. Loading of spatial datasets.<br />
Figure 3. Working with ArcCatalog.
Figure 4. Projected coordinate system of the dataset.<br />
Figure 5. Editing of appearance using ArcGIS.
Figure 6. Selection of points in map through attribute table.<br />
Figure 7. Visual identification, numerical interpretation and text representation of evaporation points<br />
in Travis through the attribute table.
Figure 8. Creation of a graph with inset map using Microsoft Excel.<br />
Figure 9. Output map of Annual evaporation in Texas.
To start with, I used ArcGIS 10.2.2 for this exercise. Spatial datasets were loaded smoothly as<br />
seen in Figure 2. In Figure 3, new personal database and feature dataset was created in ArcCatalog<br />
also, I viewed the shapefiles and other descriptions without using ArcMap. Given that I used the<br />
higher version of the software, I encountered confusion when projecting the feature dataset (Figure<br />
4). After setting things in order using ArcCatalog, I edited the loaded the shapefiles in ArcMap.<br />
Shapefile colors were modified to make it more appealing and convenient to look at as shown in<br />
Figure 5. Minor analysis was made by manipulating attribute table and creating graph (Figures 6 and<br />
7). Moreover, I learned that it is also convenient to use Microsoft Excel along with ArcGIS however, I<br />
had a little difficulty in making the inset map (Figure 8). And finally, I finished my map (Figure 9)<br />
incorporated with Texas map, a North arrow and the graphical representation of the annual<br />
evaporation in Texas.