

Effect of organic fertilizers on apparent nitrogen utilization and yield of sweet pepper (Capsicum annuum L.) as influenced by fertilizer timing
Abstract A glasshouse experiment was carried out at the University of Natural resources and Life Sciences, Vienna, Austria during the months of April to September in both 2012 and 2013 to investigate the effect of organic fertilizers on apparent nitrogen utilization and yield of sweet pepper as influenced by fertilizer timing. In two subsequent years, sweet peppers were grown in glasshouse and fertilized with 20 g N/m2 as Maltaflor®-spezial, coarse meal of fababean and horn at different times within a 30 cm wide fertilizer-band. The experiment was laid out in a Complete Randomized Design (CRD) with four replications. Data was recorded on the various parameters and subjected to statistical analysis. Yields of tomatoes, plant N uptake and apparent N utilization obtained with Maltaflor®-spezial or fababean were comparable to those of horn in both years. The apparent N utilization did not exceed 19-33 % in the first year (2012) due to a high N uptake in the control, but increased in the following year (2013) to 26-57 %, because of the poorer growth in the unfertilized control. There were marked differences in the amount of NO3 --N remaining in soil during and after cultivation, so that the N supply by Maltaflor®-spezial was higher compared to fababean and horn. Split application of a readily available organic fertilizer could be promising and an additional N mineralization could be expected by a regular hoeing of formerly fertilized plots.
Abstract
A glasshouse experiment was carried out at the University of Natural resources and Life Sciences, Vienna, Austria during the months of April to September in both 2012 and 2013 to investigate the effect of organic fertilizers on apparent nitrogen utilization and yield of sweet pepper as influenced by fertilizer timing. In two subsequent years, sweet peppers were grown in glasshouse and fertilized with 20 g N/m2 as Maltaflor®-spezial, coarse meal of fababean and horn at different times within a 30 cm wide fertilizer-band. The experiment was laid out in a Complete Randomized Design (CRD) with four replications. Data was recorded on the various parameters and subjected to statistical analysis. Yields of tomatoes, plant N uptake and apparent N utilization obtained with Maltaflor®-spezial or fababean were comparable to those of horn in both years. The apparent N utilization did not exceed 19-33 % in the first year (2012) due to a high N uptake in the control, but increased in the following year (2013) to 26-57 %, because of the poorer growth in the unfertilized control. There were marked differences in the amount of NO3 --N remaining in soil during and after cultivation, so that the N supply by Maltaflor®-spezial was higher compared to fababean and horn. Split application of a readily available organic fertilizer could be promising and an additional N mineralization could be expected by a regular hoeing of formerly fertilized plots.

Create successful ePaper yourself
Turn your PDF publications into a flip-book with our unique Google optimized e-Paper software.
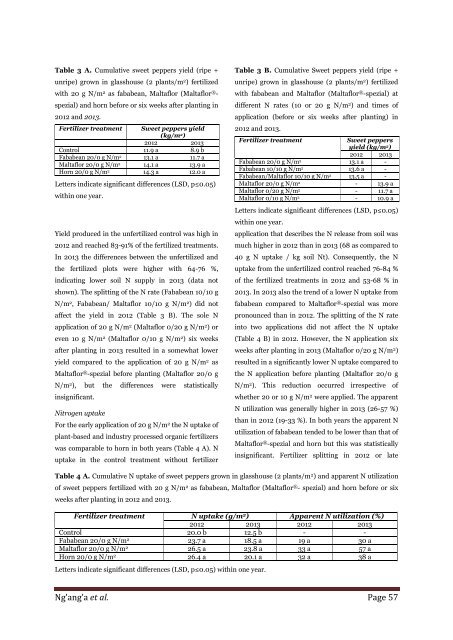
Table 3 A. Cumulative <strong>sweet</strong> <strong>pepper</strong>s <strong>yield</strong> (ripe +<br />
unripe) grown in gl<strong>as</strong>shouse (2 plants/m 2 ) fertilized<br />
with 20 g N/m 2 <strong>as</strong> fababean, Maltaflor (Maltaflor ® -<br />
spezial) <strong>and</strong> horn before or six weeks after planting in<br />
2012 <strong>and</strong> 2013.<br />
Fertilizer treatment Sweet <strong>pepper</strong>s <strong>yield</strong><br />
(kg/m 2 )<br />
2012 2013<br />
C<strong>on</strong>trol 11.9 a 8.9 b<br />
Fababean 20/0 g N/m 2 13.1 a 11.7 a<br />
Maltaflor 20/0 g N/m 2 14.1 a 13.9 a<br />
Horn 20/0 g N/m 2 14.3 a 12.0 a<br />
Letters indicate significant differences (LSD, p≤0.05)<br />
within <strong>on</strong>e year.<br />
Yield produced in the unfertilized c<strong>on</strong>trol w<strong>as</strong> high in<br />
2012 <strong>and</strong> reached 83-91% <str<strong>on</strong>g>of</str<strong>on</strong>g> the fertilized treatments.<br />
In 2013 the differences between the unfertilized <strong>and</strong><br />
the fertilized plots were higher with 64-76 %,<br />
indicating lower soil N supply in 2013 (data not<br />
shown). The splitting <str<strong>on</strong>g>of</str<strong>on</strong>g> the N rate (Fababean 10/10 g<br />
N/m 2 , Fababean/ Maltaflor 10/10 g N/m 2 ) did not<br />
affect the <strong>yield</strong> in 2012 (Table 3 B). The sole N<br />
applicati<strong>on</strong> <str<strong>on</strong>g>of</str<strong>on</strong>g> 20 g N/m 2 (Maltaflor 0/20 g N/m 2 ) or<br />
even 10 g N/m 2 (Maltaflor 0/10 g N/m 2 ) six weeks<br />
after planting in 2013 resulted in a somewhat lower<br />
<strong>yield</strong> compared to the applicati<strong>on</strong> <str<strong>on</strong>g>of</str<strong>on</strong>g> 20 g N/m 2 <strong>as</strong><br />
Maltaflor ® -spezial before planting (Maltaflor 20/0 g<br />
N/m 2 ), but the differences were statistically<br />
insignificant.<br />
Nitrogen uptake<br />
For the early applicati<strong>on</strong> <str<strong>on</strong>g>of</str<strong>on</strong>g> 20 g N/m 2 the N uptake <str<strong>on</strong>g>of</str<strong>on</strong>g><br />
plant-b<strong>as</strong>ed <strong>and</strong> industry processed <str<strong>on</strong>g>organic</str<strong>on</strong>g> <str<strong>on</strong>g><strong>fertilizer</strong>s</str<strong>on</strong>g><br />
w<strong>as</strong> comparable to horn in both years (Table 4 A). N<br />
uptake in the c<strong>on</strong>trol treatment without <strong>fertilizer</strong><br />
Table 3 B. Cumulative Sweet <strong>pepper</strong>s <strong>yield</strong> (ripe +<br />
unripe) grown in gl<strong>as</strong>shouse (2 plants/m 2 ) fertilized<br />
with fababean <strong>and</strong> Maltaflor (Maltaflor ® -spezial) at<br />
different N rates (10 or 20 g N/m 2 ) <strong>and</strong> times <str<strong>on</strong>g>of</str<strong>on</strong>g><br />
applicati<strong>on</strong> (before or six weeks after planting) in<br />
2012 <strong>and</strong> 2013.<br />
Fertilizer treatment<br />
Sweet <strong>pepper</strong>s<br />
<strong>yield</strong> (kg/m 2 )<br />
2012 2013<br />
Fababean 20/0 g N/m 2 13.1 a -<br />
Fababean 10/10 g N/m 2 13.6 a -<br />
Fababean/Maltaflor 10/10 g N/m 2 13.5 a -<br />
Maltaflor 20/0 g N/m 2 - 13.9 a<br />
Maltaflor 0/20 g N/m 2 - 11.7 a<br />
Maltaflor 0/10 g N/m 2 - 10.9 a<br />
Letters indicate significant differences (LSD, p≤0.05)<br />
within <strong>on</strong>e year.<br />
applicati<strong>on</strong> that describes the N rele<strong>as</strong>e from soil w<strong>as</strong><br />
much higher in 2012 than in 2013 (68 <strong>as</strong> compared to<br />
40 g N uptake / kg soil Nt). C<strong>on</strong>sequently, the N<br />
uptake from the unfertilized c<strong>on</strong>trol reached 76-84 %<br />
<str<strong>on</strong>g>of</str<strong>on</strong>g> the fertilized treatments in 2012 <strong>and</strong> 53-68 % in<br />
2013. In 2013 also the trend <str<strong>on</strong>g>of</str<strong>on</strong>g> a lower N uptake from<br />
fababean compared to Maltaflor ® -spezial w<strong>as</strong> more<br />
pr<strong>on</strong>ounced than in 2012. The splitting <str<strong>on</strong>g>of</str<strong>on</strong>g> the N rate<br />
into two applicati<strong>on</strong>s did not affect the N uptake<br />
(Table 4 B) in 2012. However, the N applicati<strong>on</strong> six<br />
weeks after planting in 2013 (Maltaflor 0/20 g N/m 2 )<br />
resulted in a significantly lower N uptake compared to<br />
the N applicati<strong>on</strong> before planting (Maltaflor 20/0 g<br />
N/m 2 ). This reducti<strong>on</strong> occurred irrespective <str<strong>on</strong>g>of</str<strong>on</strong>g><br />
whether 20 or 10 g N/m 2 were applied. The <strong>apparent</strong><br />
N utilizati<strong>on</strong> w<strong>as</strong> generally higher in 2013 (26-57 %)<br />
than in 2012 (19-33 %). In both years the <strong>apparent</strong> N<br />
utilizati<strong>on</strong> <str<strong>on</strong>g>of</str<strong>on</strong>g> fababean tended to be lower than that <str<strong>on</strong>g>of</str<strong>on</strong>g><br />
Maltaflor ® -spezial <strong>and</strong> horn but this w<strong>as</strong> statistically<br />
insignificant. Fertilizer splitting in 2012 or late<br />
Table 4 A. Cumulative N uptake <str<strong>on</strong>g>of</str<strong>on</strong>g> <strong>sweet</strong> <strong>pepper</strong>s grown in gl<strong>as</strong>shouse (2 plants/m 2 ) <strong>and</strong> <strong>apparent</strong> N utilizati<strong>on</strong><br />
<str<strong>on</strong>g>of</str<strong>on</strong>g> <strong>sweet</strong> <strong>pepper</strong>s fertilized with 20 g N/m 2 <strong>as</strong> fababean, Maltaflor (Maltaflor ® - spezial) <strong>and</strong> horn before or six<br />
weeks after planting in 2012 <strong>and</strong> 2013.<br />
Fertilizer treatment N uptake (g/m 2 ) Apparent N utilizati<strong>on</strong> (%)<br />
2012 2013 2012 2013<br />
C<strong>on</strong>trol 20.0 b 12.5 b - -<br />
Fababean 20/0 g N/m 2 23.7 a 18.5 a 19 a 30 a<br />
Maltaflor 20/0 g N/m 2 26.5 a 23.8 a 33 a 57 a<br />
Horn 20/0 g N/m 2 26.4 a 20.1 a 32 a 38 a<br />
Letters indicate significant differences (LSD, p≤0.05) within <strong>on</strong>e year.<br />
Ng’ang’a et al. Page 57

![Review on: impact of seed rates and method of sowing on yield and yield related traits of Teff [Eragrostis teff (Zucc.) Trotter] | IJAAR @yumpu](https://documents.yumpu.com/000/066/025/853/c0a2f1eefa2ed71422e741fbc2b37a5fd6200cb1/6b7767675149533469736965546e4c6a4e57325054773d3d/4f6e6531383245617a537a49397878747846574858513d3d.jpg?AWSAccessKeyId=AKIAICNEWSPSEKTJ5M3Q&Expires=1714096800&Signature=hqf2cEMoGAk0sAG%2FPG8%2Bfo82Dt8%3D)


