2014 Executive Summary

Create successful ePaper yourself
Turn your PDF publications into a flip-book with our unique Google optimized e-Paper software.
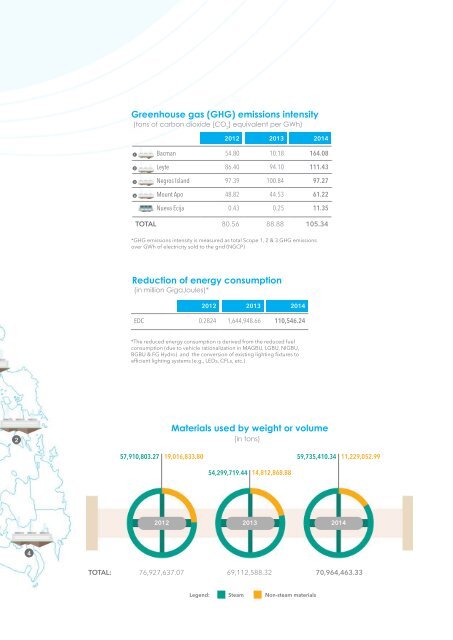
Greenhouse gas (GHG) emissions intensity<br />
(tons of carbon dioxide [CO 2<br />
] equivalent per GWh)<br />
2012 2013 <strong>2014</strong><br />
1<br />
2<br />
3<br />
4<br />
Bacman 54.80 10.18 164.08<br />
Leyte 86.40 94.10 111.43<br />
Negros Island 97.39 100.84 97.27<br />
Mount Apo 48.82 44.53 61.22<br />
Nueva Ecija 0.43 0.25 11.35<br />
TOTAL 80.56 88.88 105.34<br />
*GHG emissions intensity is measured as total Scope 1, 2 & 3 GHG emissions<br />
over GWh of electricity sold to the grid (NGCP)<br />
Reduction of energy consumption<br />
(in million GigaJoules)*<br />
2012 2013 <strong>2014</strong><br />
EDC 0.2824 1,644,948.66 110,546.24<br />
*The reduced energy consumption is derived from the reduced fuel<br />
consumption (due to vehicle rationalization in MAGBU, LGBU, NIGBU,<br />
BGBU & FG Hydro) and the conversion of existing lighting fixtures to<br />
efficient lighting systems (e.g., LEDs, CFLs, etc.)<br />
2<br />
Materials used by weight or volume<br />
(in tons)<br />
57,910,803.27 19,016,833.80 59,735,410.34 11,229,052.99<br />
54,299,719.44<br />
14,812,868.88<br />
2012 2013 <strong>2014</strong><br />
4<br />
TOTAL:<br />
76,927,637.07 69,112,588.32 70,964,463.33<br />
Legend: Steam Non-steam materials