

SCADA - Threats People Overlook
SCADA systems are the smart component that governs most of critical infrastructure and their malfunction reflects immediately on our everyday lives. Initially designed to function reliably and not to be secure, their exposure to public networks is itself a vulnerability and exposes them to Cyber Attacks. This research outlines how SCADA devices are exposed to Internet, both in quantity and quality. It provides an estimation of worldwide exposure and compares the data of the two previously chosen countries in 2013: Italy and Switzerland. As exposure alone would not translate into Risk without active attackers, a honeypot has been deployed to mimic an ICS device. Thousands of probes and exploit attempts have been recorded demonstrating that such risk scenario is more valid than ever. https://twitter.com/salvetti_alex
SCADA systems are the smart component that governs most of critical infrastructure and their malfunction reflects immediately on our everyday lives.
Initially designed to function reliably and not to be secure, their exposure to public networks is itself a vulnerability and exposes them to Cyber Attacks.
This research outlines how SCADA devices are exposed to Internet, both in quantity and quality. It provides an estimation of worldwide exposure and compares the data of the two previously chosen countries in 2013: Italy and Switzerland.
As exposure alone would not translate into Risk without active attackers, a honeypot has been deployed to mimic an ICS device. Thousands of probes and exploit attempts have been recorded demonstrating that such risk scenario is more valid than ever. https://twitter.com/salvetti_alex

Create successful ePaper yourself
Turn your PDF publications into a flip-book with our unique Google optimized e-Paper software.
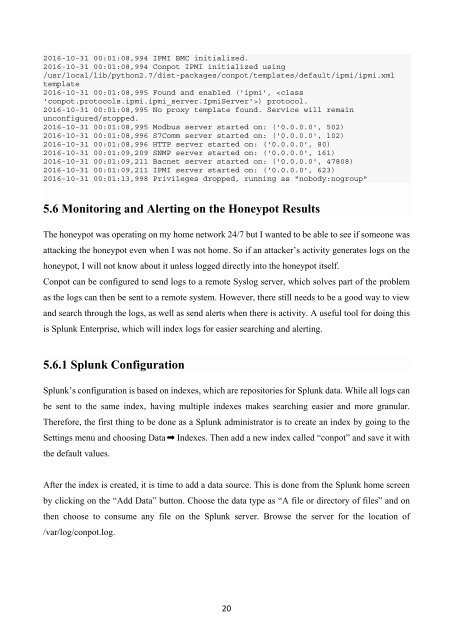
2016-10-31 00:01:08,994 IPMI BMC initialized.<br />
2016-10-31 00:01:08,994 Conpot IPMI initialized using<br />
/usr/local/lib/python2.7/dist-packages/conpot/templates/default/ipmi/ipmi.xml<br />
template<br />
2016-10-31 00:01:08,995 Found and enabled ('ipmi', ) protocol.<br />
2016-10-31 00:01:08,995 No proxy template found. Service will remain<br />
unconfigured/stopped.<br />
2016-10-31 00:01:08,995 Modbus server started on: ('0.0.0.0', 502)<br />
2016-10-31 00:01:08,996 S7Comm server started on: ('0.0.0.0', 102)<br />
2016-10-31 00:01:08,996 HTTP server started on: ('0.0.0.0', 80)<br />
2016-10-31 00:01:09,209 SNMP server started on: ('0.0.0.0', 161)<br />
2016-10-31 00:01:09,211 Bacnet server started on: ('0.0.0.0', 47808)<br />
2016-10-31 00:01:09,211 IPMI server started on: ('0.0.0.0', 623)<br />
2016-10-31 00:01:13,998 Privileges dropped, running as "nobody:nogroup"<br />
5.6 Monitoring and Alerting on the Honeypot Results<br />
The honeypot was operating on my home network 24/7 but I wanted to be able to see if someone was<br />
attacking the honeypot even when I was not home. So if an attacker’s activity generates logs on the<br />
honeypot, I will not know about it unless logged directly into the honeypot itself.<br />
Conpot can be configured to send logs to a remote Syslog server, which solves part of the problem<br />
as the logs can then be sent to a remote system. However, there still needs to be a good way to view<br />
and search through the logs, as well as send alerts when there is activity. A useful tool for doing this<br />
is Splunk Enterprise, which will index logs for easier searching and alerting.<br />
5.6.1 Splunk Configuration<br />
Splunk’s configuration is based on indexes, which are repositories for Splunk data. While all logs can<br />
be sent to the same index, having multiple indexes makes searching easier and more granular.<br />
Therefore, the first thing to be done as a Splunk administrator is to create an index by going to the<br />
Settings menu and choosing Data Indexes. Then add a new index called “conpot” and save it with<br />
the default values.<br />
After the index is created, it is time to add a data source. This is done from the Splunk home screen<br />
by clicking on the “Add Data” button. Choose the data type as “A file or directory of files” and on<br />
then choose to consume any file on the Splunk server. Browse the server for the location of<br />
/var/log/conpot.log.<br />
20