

Precipitation and temperature changes in Zayandehroud basin by the use of GCM models
Abstract Surveys show that rate of emission greenhouse gases has increased considerably in recent decades. Increasing these gases in earth‘s atmosphere leads to changes in climatic parameters of earth. By using variety of simulated models of meteorological variants in general frame of weather generators during recent decades, it is necessary to apply these changes in simulated series. In this study, using statistical down –scale for periods of 2011-2039 by using statistical model of LARSE-WG daily data of temperature rain and radiation and its results were considered on synoptic station of zayanderoud basin. Results show that changes in climatic parameters will be existed during survey period in the way that temperature mean among studied stations will increase between 1/7 centigrade and 2/9 centigrade and raining rate will be decreased.
Abstract
Surveys show that rate of emission greenhouse gases has increased considerably in recent decades. Increasing these gases in earth‘s atmosphere leads to changes in climatic parameters of earth. By using variety of simulated models of meteorological variants in general frame of weather generators during recent decades, it is necessary to apply these changes in simulated series. In this study, using statistical down –scale for periods of 2011-2039 by using statistical model of LARSE-WG daily data of temperature rain and radiation and its results were considered on synoptic station of zayanderoud basin. Results show that changes in climatic parameters will be existed during survey period in the way that temperature mean among studied stations will increase between 1/7 centigrade and 2/9 centigrade and raining rate will be decreased.

You also want an ePaper? Increase the reach of your titles
YUMPU automatically turns print PDFs into web optimized ePapers that Google loves.
<strong>temperature</strong> mean<br />
(centigrade)<br />
J. Bio. & Env. Sci. 2014<br />
600<br />
Fig. 1. Ra<strong>in</strong>fall comparison <strong>of</strong> statistical period with<br />
ra<strong>in</strong>fall <strong>of</strong> <strong>GCM</strong> <strong>models</strong> <strong>and</strong> emission scenarios <strong>in</strong><br />
Koohrang station.<br />
400<br />
200<br />
0<br />
2039<br />
2034<br />
2029<br />
2024<br />
2019<br />
2014<br />
2009<br />
2004<br />
1999<br />
1994<br />
1989<br />
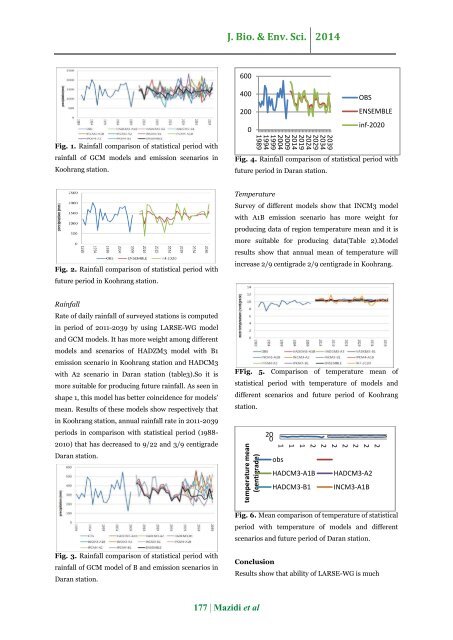
Fig. 4. Ra<strong>in</strong>fall comparison <strong>of</strong> statistical period with<br />
future period <strong>in</strong> Daran station.<br />
OBS<br />
ENSEMBLE<br />
<strong>in</strong>f-2020<br />
Fig. 2. Ra<strong>in</strong>fall comparison <strong>of</strong> statistical period with<br />
future period <strong>in</strong> Koohrang station.<br />
Temperature<br />
Survey <strong>of</strong> different <strong>models</strong> show that INCM3 model<br />
with A1B emission scenario has more weight for<br />
produc<strong>in</strong>g data <strong>of</strong> region <strong>temperature</strong> mean <strong>and</strong> it is<br />
more suitable for produc<strong>in</strong>g data(Table 2).Model<br />
results show that annual mean <strong>of</strong> <strong>temperature</strong> will<br />
<strong>in</strong>crease 2/9 centigrade 2/9 centigrade <strong>in</strong> Koohrang.<br />
Ra<strong>in</strong>fall<br />
Rate <strong>of</strong> daily ra<strong>in</strong>fall <strong>of</strong> surveyed stations is computed<br />
<strong>in</strong> period <strong>of</strong> 2011-2039 <strong>by</strong> us<strong>in</strong>g LARSE-WG model<br />
<strong>and</strong> <strong>GCM</strong> <strong>models</strong>. It has more weight among different<br />
<strong>models</strong> <strong>and</strong> scenarios <strong>of</strong> HADZM3 model with B1<br />
emission scenario <strong>in</strong> Koohrang station <strong>and</strong> HADCM3<br />
with A2 scenario <strong>in</strong> Daran station (table3).So it is<br />
more suitable for produc<strong>in</strong>g future ra<strong>in</strong>fall. As seen <strong>in</strong><br />
shape 1, this model has better co<strong>in</strong>cidence for <strong>models</strong>’<br />
mean. Results <strong>of</strong> <strong>the</strong>se <strong>models</strong> show respectively that<br />
<strong>in</strong> Koohrang station, annual ra<strong>in</strong>fall rate <strong>in</strong> 2011-2039<br />
periods <strong>in</strong> comparison with statistical period (1988-<br />
2010) that has decreased to 9/22 <strong>and</strong> 3/9 centigrade<br />
Daran station.<br />
FFig. 5. Comparison <strong>of</strong> <strong>temperature</strong> mean <strong>of</strong><br />
statistical period with <strong>temperature</strong> <strong>of</strong> <strong>models</strong> <strong>and</strong><br />
different scenarios <strong>and</strong> future period <strong>of</strong> Koohrang<br />
station.<br />
20<br />
0<br />
2<br />
2<br />
2<br />
2<br />
2<br />
2<br />
2<br />
1<br />
1<br />
1<br />
obs<br />
HADCM3-A1B<br />
HADCM3-B1<br />
HADCM3-A2<br />
INCM3-A1B<br />
Fig. 6. Mean comparison <strong>of</strong> <strong>temperature</strong> <strong>of</strong> statistical<br />
period with <strong>temperature</strong> <strong>of</strong> <strong>models</strong> <strong>and</strong> different<br />
scenarios <strong>and</strong> future period <strong>of</strong> Daran station.<br />
Fig. 3. Ra<strong>in</strong>fall comparison <strong>of</strong> statistical period with<br />
ra<strong>in</strong>fall <strong>of</strong> <strong>GCM</strong> model <strong>of</strong> B <strong>and</strong> emission scenarios <strong>in</strong><br />
Daran station.<br />
Conclusion<br />
Results show that ability <strong>of</strong> LARSE-WG is much<br />
177 | Mazidi et al

![Review on: impact of seed rates and method of sowing on yield and yield related traits of Teff [Eragrostis teff (Zucc.) Trotter] | IJAAR @yumpu](https://documents.yumpu.com/000/066/025/853/c0a2f1eefa2ed71422e741fbc2b37a5fd6200cb1/6b7767675149533469736965546e4c6a4e57325054773d3d/4f6e6531383245617a537a49397878747846574858513d3d.jpg?AWSAccessKeyId=AKIAICNEWSPSEKTJ5M3Q&Expires=1717282800&Signature=DtkTQsxZDRyOl0iJAsjCIzqjJnk%3D)


