Tlingit Moon & Tide - Alaska Native Knowledge Network - University ...
Tlingit Moon & Tide - Alaska Native Knowledge Network - University ...
Tlingit Moon & Tide - Alaska Native Knowledge Network - University ...

Create successful ePaper yourself
Turn your PDF publications into a flip-book with our unique Google optimized e-Paper software.
40 • The <strong>Tlingit</strong> <strong>Moon</strong> and <strong>Tide</strong> Teaching Resource<br />
Activity 3: Predicting the <strong>Tide</strong><br />
Overview<br />
In this activity, students will apply their knowledge from the<br />
past two activities to predict when the tide will be highest and<br />
lowest. This will require that students continue to observe the<br />
tide for several weeks. They will graph the tidal cycle as part of<br />
the analysis and prediction. Teachers need to time this activity<br />
so that students will see a shifting low or high tide during the<br />
day.<br />
Materials and Equipment<br />
• Chart-size graph paper<br />
• Local tide table book and overhead of same<br />
• Graph paper<br />
• Student data books<br />
Activity<br />
Students should continue tidal observations for 2 weeks.<br />
They can observe the tides as part of their daily activities (on<br />
the way to or from school, after school, during lunch, etc.).<br />
They should continue to use their key landmarks as guides and<br />
not use tide books. Identify the time of the last recorded high or<br />
low tide and predict when the next tide change will occur.<br />
Have students record their predictions. Continue comparing<br />
predictions and observations for another week.<br />
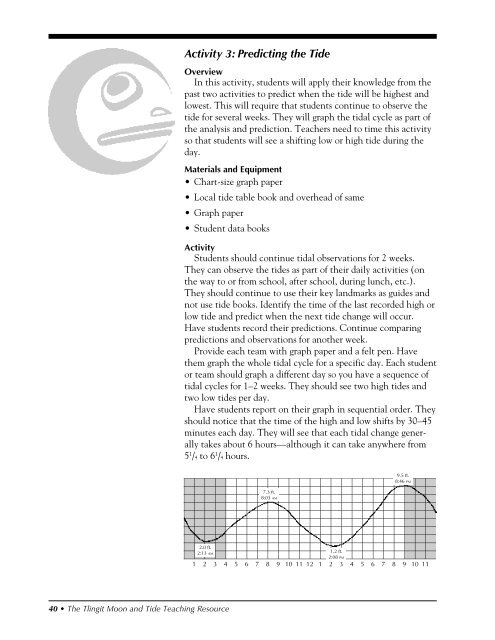
Provide each team with graph paper and a felt pen. Have<br />
them graph the whole tidal cycle for a specific day. Each student<br />
or team should graph a different day so you have a sequence of<br />
tidal cycles for 1–2 weeks. They should see two high tides and<br />
two low tides per day.<br />
Have students report on their graph in sequential order. They<br />
should notice that the time of the high and low shifts by 30–45<br />
minutes each day. They will see that each tidal change generally<br />
takes about 6 hours—although it can take anywhere from<br />
5 1 /4 to 6 1 /4 hours.<br />
_______________________________________________________________<br />
9.5 ft.<br />
8:46 PM<br />
_______________________________________________________________<br />
_______________________________________________________________<br />
7.3 ft.<br />
_______________________________________________________________<br />
8:03 AM<br />
_______________________________________________________________<br />
_______________________________________________________________<br />
_______________________________________________________________<br />
_______________________________________________________________<br />
_______________________________________________________________<br />
_______________________________________________________________<br />
2.0 ft.<br />
2:13 1.2 ft.<br />
AM<br />
_______________________________________________________________<br />
2:08 PM<br />
1 2 3 4 5 6 7 8 9 10 11 12 1 2 3 4 5 6 7 8 9 10 11<br />
____________________<br />
____________________<br />
____________________<br />
____________________<br />
____________________<br />
____________________<br />
____________________<br />
____________________<br />
____________________<br />
____________________<br />
____________________<br />
____________________<br />
____________________<br />
____________________<br />
____________________<br />
____________________<br />
____________________<br />
____________________<br />
____________________<br />
____________________<br />
____________________<br />
____________________<br />
____________________<br />
____________________<br />
____________________