2009_URS_AR

You also want an ePaper? Increase the reach of your titles
YUMPU automatically turns print PDFs into web optimized ePapers that Google loves.
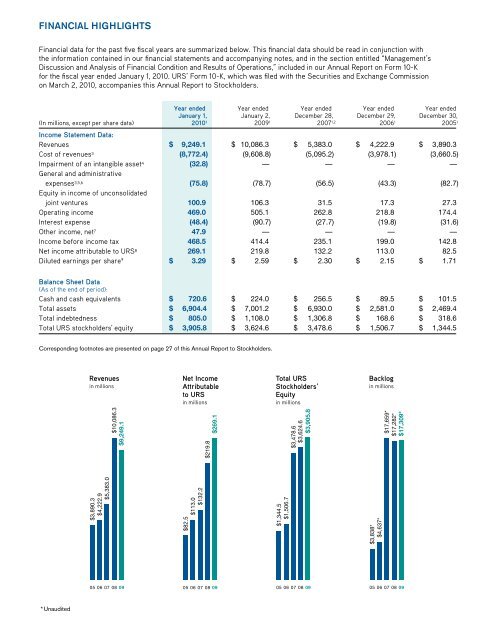
Financial Highlights<br />
Financial data for the past five fiscal years are summarized below. This financial data should be read in conjunction with<br />
the information contained in our financial statements and accompanying notes, and in the section entitled “Management’s<br />
Discussion and Analysis of Financial Condition and Results of Operations,” included in our Annual Report on Form 10-K<br />
for the fiscal year ended January 1, 2010. <strong>URS</strong>’ Form 10-K, which was filed with the Securities and Exchange Commission<br />
on March 2, 2010, accompanies this Annual Report to Stockholders.<br />
Year ended Year ended Year ended Year ended Year ended<br />
January 1, January 2, December 28, December 29, December 30,<br />
(In millions, except per share data) 2010 1 <strong>2009</strong> 1 2007 1,2 2006 1 2005 1<br />
Income Statement Data:<br />
Revenues $ 9,249.1 $ 10,086.3 $ 5,383.0 $ 4,222.9 $ 3,890.3<br />
Cost of revenues 3 (8,772.4) (9,608.8) (5,095.2) (3,978.1) (3,660.5)<br />
Impairment of an intangible asset 4 (32.8) — — — —<br />
General and administrative<br />
expenses 3,5,6 (75.8) (78.7) (56.5) (43.3) (82.7)<br />
Equity in income of unconsolidated<br />
joint ventures 100.9 106.3 31.5 17.3 27.3<br />
Operating income 469.0 505.1 262.8 218.8 174.4<br />
Interest expense (48.4) (90.7) (27.7) (19.8) (31.6)<br />
Other income, net 7 47.9 — — — —<br />
Income before income tax 468.5 414.4 235.1 199.0 142.8<br />
Net income attributable to <strong>URS</strong> 8 269.1 219.8 132.2 113.0 82.5<br />
Diluted earnings per share 9 $ 3.29 $ 2.59 $ 2.30 $ 2.15 $ 1.71<br />
Balance Sheet Data<br />
(As of the end of period):<br />
Cash and cash equivalents $ 720.6 $ 224.0 $ 256.5 $ 89.5 $ 101.5<br />
Total assets $ 6,904.4 $ 7,001.2 $ 6,930.0 $ 2,581.0 $ 2,469.4<br />
Total indebtedness $ 805.0 $ 1,108.0 $ 1,306.8 $ 168.6 $ 318.6<br />
Total <strong>URS</strong> stockholders’ equity $ 3,905.8 $ 3,624.6 $ 3,478.6 $ 1,506.7 $ 1,344.5<br />
Corresponding footnotes are presented on page 27 of this Annual Report to Stockholders.<br />
Revenues<br />
in millions<br />
Net Income<br />
Attributable<br />
to <strong>URS</strong><br />
in millions<br />
Total <strong>URS</strong><br />
Stockholders’<br />
Equity<br />
in millions<br />
Backlog<br />
in millions<br />
$3,890.3<br />
$4,222.9<br />
$5,383.0<br />
$82.5<br />
$113.0<br />
$132.2<br />
$1,344.5<br />
$1,506.7<br />
$3,838*<br />
$4,637*<br />
$10,086.3<br />
$9,249.1<br />
$219.8<br />
$269.1<br />
$3,478.6<br />
$3,624.6<br />
$3,905.8<br />
$17,659*<br />
$17,282*<br />
$17,309*<br />
05 06 07 08 09<br />
05 06 07 08 09<br />
05 06 07 08 09<br />
05 06 07 08 09<br />
* Unaudited<br />
1