

Mount Royal Manor Offering Memorandum
Mount Royal Manor is a 114 unit apartment community located in the Chester Park neighborhood of Duluth, Minnesota. The seven-story building gives tenants picturesque and unparalleled views of the University, downtown Canal Park, and Lake Superior, creating a true North Shore experience for residents.
Mount Royal Manor is a 114 unit apartment community located in the Chester Park neighborhood of Duluth, Minnesota. The seven-story building gives tenants picturesque and unparalleled views of the University, downtown Canal Park, and Lake Superior, creating a true North Shore experience for residents.

Create successful ePaper yourself
Turn your PDF publications into a flip-book with our unique Google optimized e-Paper software.
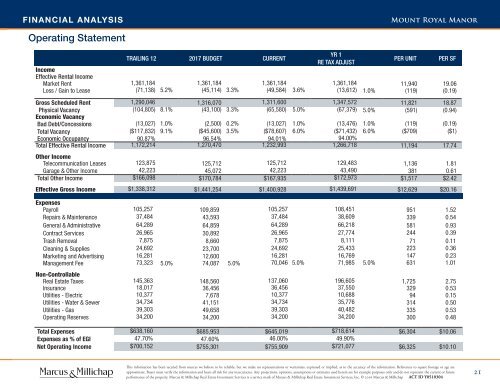
FINANCIAL ANALYSIS<br />
<strong>Mount</strong> <strong>Royal</strong> <strong>Manor</strong><br />
Operating Statement<br />
YR 1<br />
TRAILING 12 2017 BUDGET CURRENT<br />
PER UNIT PER SF<br />
RE TAX ADJUST<br />
Income<br />
Effective Rental Income<br />
Market Rent 1,361,184 1,361,184 1,361,184 1,361,184 11,940 19.06<br />
Loss / Gain to Lease (71,138) 5.2% (45,114) 3.3% (49,584) 3.6% (13,612) 1.0% (119) (0.19)<br />
Gross Scheduled Rent 1,290,046 1,316,070 1,311,600 1,347,572 11,821 18.87<br />
Physical Vacancy (104,805) 8.1% (43,100) 3.3% (65,580) 5.0% (67,379) 5.0% (591) (0.94)<br />
Economic Vacancy<br />
Bad Debt/Concessions (13,027) 1.0% (2,500) 0.2% (13,027) 1.0% (13,476) 1.0% (119) (0.19)<br />
Total Vacancy ($117,832) 9.1% ($45,600) 3.5% ($78,607) 6.0% ($71,432) 6.0% ($709) ($1)<br />
Economic Occupancy 90.87% 96.54% 94.01% 94.00%<br />
Total Effective Rental Income 1,172,214 1,270,470 1,232,993 1,266,718 11,194 17.74<br />
Other Income<br />
Telecommunication Leases 123,875 125,712 125,712 129,483 1,136 1.81<br />
Garage & Other Income 42,223 45,072 42,223 43,490 381 0.61<br />
Total Other Income $166,098 $170,784 $167,935 $172,973 $1,517 $2.42<br />
Effective Gross Income $1,338,312 $1,441,254 $1,400,928 $1,439,691 $12,629 $20.16<br />
Expenses<br />
Payroll 105,257 109,859 105,257 108,451 951 1.52<br />
Repairs & Maintenance 37,484 43,593 37,484 38,609 339 0.54<br />
General & Administrative 64,289 64,859 64,289 66,218 581 0.93<br />
Contract Services 26,965 30,892 26,965 27,774 244 0.39<br />
Trash Removal 7,875 8,660 7,875 8,111 71 0.11<br />
Cleaning & Supplies 24,692 23,700 24,692 25,433 223 0.36<br />
Marketing and Advertising 16,281 12,600 16,281 16,769 147 0.23<br />
Management Fee 73,323 5.0% 74,087 5.0% 70,046 5.0% 71,985 5.0% 631 1.01<br />
Non-Controllable<br />
Real Estate Taxes 145,363 148,560 137,060 196,605 1,725 2.75<br />
Insurance 18,017 36,456 36,456 37,550 329 0.53<br />
Utilities - Electric 10,377 7,678 10,377 10,688 94 0.15<br />
Utilities - Water & Sewer 34,734 41,151 34,734 35,776 314 0.50<br />
Utilities - Gas 39,303 49,658 39,303 40,482 335 0.53<br />
Operating Reserves 34,200 34,200 34,200 34,200 300 0.48<br />
Total Expenses $638,160 $685,953 $645,019 $718,614 $6,304 $10.06<br />
Expenses as % of EGI 47.70% 47.60% 46.00% 49.90%<br />
Net Operating Income $700,152 $755,301 $755,909 $721,077 $6,325 $10.10<br />
This information has been secured from sources we believe to be reliable, but we make no representations or warranties, expressed or implied, as to the accuracy of the information. References to square footage or age are<br />
approximate. Buyer must verify the information and bears all risk for any inaccuracies. Any projections, opinions, assumptions or estimates used herein are for example purposes only and do not represent the current or future<br />
performance of the property. Marcus & Millichap Real Estate Investment Services is a service mark of Marcus & Millichap Real Estate Investment Services, Inc. © 2016 Marcus & Millichap ACT ID Y0510304<br />
21