annual_repport_staatsolie_2016_lr

Create successful ePaper yourself
Turn your PDF publications into a flip-book with our unique Google optimized e-Paper software.
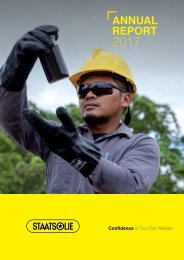
<strong>annual</strong><br />
report<br />
<strong>2016</strong><br />
Confidence in Our Own Abilities
<strong>annual</strong><br />
report<br />
<strong>2016</strong>
Vision<br />
• Leading the sustainable development of Suriname’s energy industry.<br />
• Making a strong contribution to the advancement of our society.<br />
• Becoming a regional player with a global identity in the energy.<br />
Mission<br />
To develop Suriname’s<br />
hydrocarbon potential<br />
over the full value chain,<br />
to generate electricity<br />
and to develop renewable<br />
sustainable energy resources.<br />
To secure the energy<br />
supply of Suriname and to<br />
establish a solid position<br />
in the regional market.<br />
To expand our reputation based<br />
on our growth performance,<br />
flexibility and corporate<br />
social responsibility.<br />
Values<br />
HSEC Focused:<br />
We put health and safety first,<br />
strive for zero harm to our people<br />
and the communities around us,<br />
and minimize negative impacts<br />
upon the environment.<br />
Integrity:<br />
We are honest and do what we say<br />
we will do.<br />
People Focused:<br />
We create a supportive and<br />
collaborative environment,<br />
respect each other, are open<br />
to other’s ideas and facilitate<br />
personal and professional growth.<br />
Excellence:<br />
We set high standards for quality,<br />
strive to exceed expectations<br />
and do our work with a sense of<br />
urgency.<br />
Accountability:<br />
We accept responsibility for our<br />
job and actions, are co‐operative,<br />
and create a non‐blaming<br />
environment.
Annual REPORT<br />
Confidence in Our Own Abilities 5<br />
Overview <strong>2016</strong><br />
5.98 million barrels<br />
Crude Production<br />
Gross Revenues<br />
(<strong>2016</strong> vs 2015)<br />
$ 368 million $ 591 million<br />
700.000<br />
man-hours<br />
without a LTI<br />
<strong>2016</strong> 2015<br />
Refinery Production<br />
Fuel Oil<br />
Premium<br />
Gasoline<br />
Premium<br />
Diesel<br />
Bitumen<br />
30.2K bbls 292.8K bbls 1,489.7K bbls 1,974K bbls
Annual REPORT<br />
Confidence in Our Own Abilities<br />
6<br />
08 I Shareholder, Supervisory Board, Board of<br />
Executive Directors and Management<br />
10 II Letter of the Managing Director<br />
14 III Operational Performance <strong>2016</strong><br />
26 IV Management’s Analysis of Operations and<br />
Financial Condition<br />
32 V Independent Auditor’s Report<br />
33 VI Consolidated Financial Statements <strong>2016</strong><br />
42 VII Notes to the Consolidated Financial Statements<br />
61 VIII Staatsolie Separate Company Financial<br />
Statements <strong>2016</strong><br />
66 IX Other Information<br />
67 X Five Years Consolidated Income Statements<br />
67 XI Supplemental Information on Oil Producing<br />
Activities (Unaudited)
Annual REPORT<br />
Confidence in Our Own Abilities 7<br />
Supervisory Board (from the left):<br />
A. Immanuel, Member<br />
E. Poetisi, Member<br />
E. Boerenveen, Chairman<br />
I. Tholen, Secretary<br />
G. Asadang, Member<br />
M. Rommy, Member
Annual REPORT<br />
Confidence in Our Own Abilities<br />
8<br />
I Shareholder, Supervisory Board,<br />
Board of Executive Directors and<br />
Management<br />
As at December 31, <strong>2016</strong><br />
Sole Shareholder<br />
The Republic of Suriname represented by:<br />
• the President, His Excellency<br />
D.D. Bouterse, on his behalf:<br />
• the Vice President, A. M. Adhin<br />
Supervisory Board<br />
E. Boerenveen Chairman<br />
G. Asadang Member<br />
A. Immanuel Member<br />
E. Poetisi Member<br />
M. Rommy Member<br />
Board of Executive Director<br />
R. Elias Managing Director<br />
B. Dwarkasing Upstream Director<br />
A. Moensi‐Sokowikromo Finance Director<br />
Deputy Directors<br />
A. Jagesar Downstream Deputy<br />
Director<br />
Division Managers<br />
I. Ambrose Manager Corporate<br />
Audit<br />
R. Bissumbhar Manager Production<br />
Unit Tambaredjo<br />
D. Brunings Manager Corporate<br />
Communication<br />
P. Brunings Production Asset<br />
Manager<br />
M. Daal‐Vogelland Manager Petroleum<br />
Contracts<br />
J. Gajadin‐Joella Manager Corporate<br />
Legal Affairs<br />
W. Gajapersad Manager Refining<br />
Operations<br />
P. Goerdajal Manager Drilling<br />
Operations<br />
T. Haarloo Manager Corporate<br />
HRM<br />
C. Hughes Refinery Asset<br />
Manager<br />
V. Jadnanansing Manager Marketing<br />
D. Kertotiko Manager Technical<br />
Support Services<br />
J. Kalpoe Manager<br />
Maintenance &<br />
Turnaround Refinery<br />
K. Lie A Kwie Manager Health, Safety<br />
& Environment TLF<br />
S. Mannes Manager Health,<br />
Safety, Environment<br />
& Quality Corporate<br />
B. Nandlal Manager Functional<br />
Support Services<br />
A. Nelson Manager Exploration<br />
D. Pello Manager Technical<br />
Services<br />
R. Ramautar Manager Renewable<br />
Energy Sources<br />
A. Ramsaransingh‐Karg Manager Corporate<br />
Procurement<br />
A. Schuitemaker‐Nghollo Manager Production<br />
Unit TNW/Calcutta<br />
A. Sleman Manager Information &<br />
Communication<br />
Technology<br />
R. Soekhlal Manager Health,<br />
Safety & Environment<br />
Upstream<br />
A. Vermeer Manager Finance<br />
& Treasury<br />
M. Woelkens Manager Business<br />
Economics<br />
Managers assigned<br />
T. Ketele Project Director<br />
Refinery Expansion<br />
Subsidiaries<br />
L. Brunings Chief Financial<br />
Officer Ventrin<br />
E. Fränkel Managing<br />
Director Staatsolie<br />
Power Company<br />
Suriname N.V.<br />
A. Ghent Chief Executive Officer<br />
Ventrin<br />
C. Heuvel Finance Director GOw2<br />
Energy Suriname N.V.<br />
A. Kleiboer Operations Manager<br />
Staatsolie Power<br />
Company Suriname N.V.<br />
A. Nai Chung Tong Managing Director<br />
GOw2 Energy<br />
Suriname N.V.
Annual REPORT<br />
Confidence in Our Own Abilities 9<br />
Board of Executive Directors (from the left):<br />
B. Dwarkasing, Upstream Director<br />
R. Elias, Managing Director<br />
A. Moensi‐Sokowikromo, Finance Director<br />
A. Jagesar, Downstream Deputy Director
Annual REPORT<br />
Confidence in Our Own Abilities<br />
10<br />
II Letter of<br />
the Managing Director<br />
With an average oil price that fell below the cash<br />
cost in the first quarter of <strong>2016</strong>, and the resultant<br />
negative impact this had on our cash flow and<br />
debt servicing capacity, <strong>2016</strong> was one of the most<br />
difficult years Staatsolie has ever confronted.<br />
These factors thoroughly tested our business,<br />
people and resolve. Together, we successfully<br />
navigated through these challenges to emerge as<br />
an excelling organization. It also highlighted the<br />
importance of adhering to our core values and<br />
strategy.<br />
Navigating a Challenging Year<br />
The price of Saramacca Crude is linked to USGC<br />
HSFO Waterborne. In January <strong>2016</strong>, this price fell<br />
to US$ 16 per barrel. Because of this extremely low<br />
oil price, in early <strong>2016</strong> we were challenged by the<br />
inherent time and cost it took to bring on‐stream<br />
our substantial, value‐enhancing investments in<br />
our refinery and the Merian gold mine. Because<br />
significant debt repayments were due prior to<br />
realizing these investments’ value and positive<br />
cash‐flow affects, we had to take immediate steps<br />
to protect our company. These included cutting all<br />
investments that were not necessary to sustain<br />
production, and initially even halted drilling new<br />
production wells.<br />
We further took company‐wide cost reduction<br />
measures to cut our operational expenditures,<br />
including a complete freeze on hiring personnel.<br />
As we began to reap the rewards of our cash‐saving<br />
efforts, by the middle of the year we had reached<br />
a positive cash position. We succeeded to<br />
refinance our debt position and met our debt<br />
obligations of our US$ 600 million syndicated loan<br />
in the last quarter of <strong>2016</strong>. We also freed up cash<br />
to invest in our upstream operations, restarting<br />
our production drilling program. This program in<br />
turn arrested the production decline which had<br />
resulted from cutting all investments in the first<br />
half of <strong>2016</strong>.<br />
The Upstream achieved only a 4% drop in<br />
production over the year despite a 20% reduction<br />
in producing wells. A testament to the team<br />
working closely together to achieve great results<br />
in difficult circumstance.<br />
Overall, in <strong>2016</strong> we achieved an average crude<br />
production of 16,327 bopd, equating to a total<br />
production of 5.98 MMbbls.<br />
The challenging oil price environment, lower<br />
than planned production as a consequence<br />
of our austerity drive and teething problems
Annual REPORT<br />
Confidence in Our Own Abilities 11<br />
at the newly commissioned refinery negatively<br />
impacted revenue and profits for the year. In <strong>2016</strong>,<br />
Staatsolie’s consolidated total gross revenues<br />
amounted to US$ 368 million, 38% less compared<br />
to the US$ 591 million in 2015. The average net<br />
sales price per barrel for <strong>2016</strong> was US$ 41.44, a<br />
decrease of 8% in comparison with 2015. Profit<br />
before tax was US$ 12.7 million compared to US$<br />
28.9 million in 2015.<br />
It is important to note that our <strong>2016</strong> results were<br />
achieved in the context of our company wide<br />
commitment to zero harm to our people and the<br />
communities around us, our strong commitment<br />
across all our operations. We had no fatalities in<br />
<strong>2016</strong> but we did experience a small increase in<br />
our Lost Time Injury frequency. We will work hard<br />
to ensure we reverse this in 2017 by helping our<br />
people to reduce risks onsite, and continuing to<br />
foster a culture of mutual responsibility.<br />
A Strategy for Success<br />
With oil prices now becoming ever more<br />
unshackled from OPEC, we can expect ongoing<br />
volatility. We cannot control this; however, we<br />
can control how we run our business and ensure<br />
that it is tuned to the likely ongoing price volatility<br />
that lies ahead. Fundamentally, we must strive to<br />
stay in the lowest cost quartile of oil producers.<br />
By doing this, Staatsolie will be a robust business,<br />
able to provide valuable returns to its shareholder<br />
and the people of Suriname for many decades to<br />
come.<br />
It is this goal which has driven our program of<br />
reorganization into asset based management.<br />
In practice, this means all members of an<br />
asset team understand their role in that asset’s<br />
success, and their responsibility to run that<br />
asset safely, cost effectively and efficiently. To<br />
support this, we will hold the people within our<br />
organization accountable for their results. Our<br />
incentives programs will, as of 2017, be based<br />
on Key Performance Indicators linked to each<br />
asset, with our corporate team’s targets partly<br />
linked to the success of the assets. Indeed, the<br />
asset reorganization was a substantial factor that<br />
helped us secure our future in one of the most<br />
challenging years in Staatsolie’s history.<br />
A Culture of Ownership<br />
It is through an embedded culture of ownership<br />
and pride that we will secure our future.That is why<br />
We must strive to stay in<br />
the lowest cost quartile<br />
of oil producers. By doing<br />
this, Staatsolie will be a<br />
robust business.<br />
we will be rolling out a culture change program<br />
in 2017 based on our Core Values (Health Safety<br />
Environment Community Focused, Integrity, People<br />
Focused, Excellence and Accountability). This<br />
includes everyone throughout the organization,<br />
from our workforce in the operations to our most<br />
senior leaders. In particular, I want Staatsolie to<br />
harness the promise embodied in our bright, young<br />
team members and encourage them to voice their<br />
opinions – it is after all, this group who will shape<br />
the future of our business.<br />
It is my firm belief, that through all of us at Staatsolie<br />
taking ownership of our role in the business, we<br />
will make each of our assets efficient and well run<br />
businesses in their own right.<br />
With our expanded drilling program and embedded<br />
asset based management, we will regain our desired<br />
average crude production of 17,000 bopd in 2017.<br />
By achieving this target and continuing to raise the<br />
output of our refinery we will be able to show steady<br />
operations and refinance our outstanding US$ 300<br />
million syndicated loan on more favorable terms.<br />
This in turn will free up the necessary funds to<br />
support exploration in the nearshore, opening new<br />
reserves towards our journey to 24,000 bopd over<br />
the next decade, creating substantially more value<br />
for our shareholder and the people of Suriname.
Annual REPORT<br />
Confidence in Our Own Abilities<br />
12<br />
The Offshore Promise<br />
When we make a big discovery in the offshore, as I<br />
believe we will do in the coming years, a whole new<br />
era for Staatsolie and Suriname will commence.<br />
My confidence in us making a big offshore<br />
discovery is not only my own ‐ a number of<br />
international oil companies also share my<br />
optimism. We are currently negotiating Production<br />
Sharing Contracts (PSC’s) for blocks 59 and 60,<br />
and our current PSC partners are actively exploring<br />
across other offshore blocks. Like myself, these<br />
international oil companies recognize that geology<br />
knows no national borders and with the giant<br />
Liza discovery in offshore Guyana, one of the<br />
largest recent finds only 80 kilometers from our<br />
border, Suriname’s geology also holds real and<br />
exciting promise. And if that promise is fulfilled,<br />
we can then take the next step in our business<br />
by accessing even greater capital to invest in our<br />
business through an Initial Private Offering (IPO).<br />
A Positive Future<br />
Reflecting on <strong>2016</strong>, I thank and acknowledge<br />
all our employees for their tireless efforts to<br />
secure a sustainable future for our business, our<br />
Shareholder for the support we have been given,<br />
our Supervisory Board for the guidance provided<br />
and our customers for the continuing business.<br />
With investments now delivering positive cash<br />
flow, including the Merian gold mine which has<br />
come into production on time and below budget<br />
and the refinery increasing its output, we have<br />
excellent momentum into this year. With our clear<br />
plans and a focused team, the future is truly an<br />
exciting place for Staatsolie and our country.<br />
Thank you!<br />
Rudolf Elias<br />
Managing Director<br />
Staatsolie Maatschappij Suriname NV
Annual REPORT<br />
Confidence in Our Own Abilities 13<br />
When we make a big<br />
discovery in the offshore,<br />
as I believe we will do in<br />
the coming years, a whole<br />
new era for Staatsolie and<br />
Suriname will commence.<br />
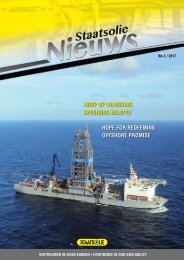
Drill head of the Noble Bob Douglas drill ship.
Annual REPORT<br />
Confidence in Our Own Abilities<br />
14<br />
III Operational<br />
performance <strong>2016</strong><br />
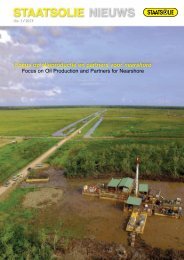
Crude treatment plant TA58 in Saramacca.<br />
Financial Performance<br />
The price of Saramacca Crude is linked to the<br />
USGC HSFO Waterborne. In early 2013, this<br />
particular product would sell at US$ 100 per<br />
barrel. In Januar y <strong>2016</strong>, the price plunged to<br />
US$ 16. This dramatically impacted our<br />
revenues and profit in <strong>2016</strong>. In <strong>2016</strong>, Staatsolie’s<br />
consolidated total gross revenues amounted<br />
to US$ 368 million. The average net sales price<br />
per barrel for <strong>2016</strong> was US$ 41.44, a decrease<br />
of 8% in comparison with 2015. Profit before<br />
tax including an income of US$ 8 million related<br />
to our participation in the Merian Gold Mine<br />
amounted to US$ 12.7 million, compared to<br />
US$ 28.9 million in 2015. This decrease was<br />
primarily caused by the substantial decrease in the<br />
price of oil per barrel and reduced production as<br />
part of our austerity drive in the first half of <strong>2016</strong>.<br />
Consequently, contributions to the Government<br />
budget amounted to US$ 39.6 million.<br />
Refinancing<br />
We were able to refinance our outstanding US$ 600<br />
million syndicated loan ‐ US$ 261 million is now<br />
structured across 10 years with the Government<br />
of Suriname and the remaining US$ 300 million<br />
syndicated loan remains structured over 3 years.<br />
This restructure has freed up additional capital to<br />
invest in production. And should we show steady<br />
crude production and reach refinery targets in<br />
1<br />
2017, we anticipate refinancing the outstanding<br />
US$ 300 million syndicated loan on better terms.<br />
Reserves<br />
As of 31 December <strong>2016</strong>, proven reserves remained<br />
at 84 millions of stock tank barrels (MMSTB)<br />
compared to year‐end 2015. With 6 million MMSTB<br />
produced in <strong>2016</strong>, the 1:1 replacement ratio was<br />
achieved due to parameter changes because of<br />
field decline in the Tambaredjo and Tambaredjo<br />
North West field, and a stable watercut in the<br />
Tambaredjo North West field.<br />
Upstream<br />
Exploration<br />
With the focus on production, combined with the<br />
challenging cash position of the company, no<br />
new exploration data acquisition projects were<br />
executed in <strong>2016</strong>. Our focus in <strong>2016</strong> was exploration<br />
of the Nearshore blocks, with additional in‐house<br />
evaluation of data gathered up to 2015.<br />
A complete Block 4 geological and geophysical<br />
evaluation was carried out in <strong>2016</strong> which included<br />
the results of the 2015 drilling program. Additional<br />
drilling is required before economic volumes can<br />
be established. In addition, as part of the complete<br />
nearshore evaluation, all available nearshore<br />
seismic, well and other data were included in<br />
several studies. These studies delivered an<br />
1
Annual REPORT<br />
Confidence in Our Own Abilities 15<br />
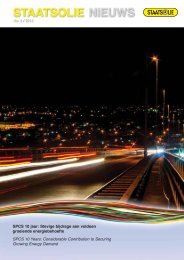
Operators at work in the control room of the SPCS power plant.<br />
expanded portfolio of risked and ranked leads in<br />
the nearshore area – with additional prospects<br />
defined within the area outside of Block 4. In<br />
total, we identified a portfolio of 43 leads at<br />
various stratigraphic intervals with propective<br />
petroleum resources estimated between 450<br />
MMbbls and 1.8 Billion bbls. Based on the results<br />
of the nearshore evaluation, the nearshore block<br />
boundaries were re‐defined into 4 blocks, Block A,<br />
B, C and D (previously Blocks 1 – 7). The combined<br />
set of leads and prospects will serve as a basis<br />
for our nearshore strategy during 2017‐2021,<br />
for which Staatsolie is seeking joint venture<br />
partners to share the exploration risks, thereby<br />
accelerating the exploration and development of<br />
the nearshore. To this end, a process of attracting<br />
potential partners for the most prolific blocks (B<br />
and C) was initiated and a Virtual Data Room (VDR)<br />
was set up to allow potential parties to view data<br />
online. We are optimistic that farm‐in agreements<br />
will be entered with at least one partner in 2017.<br />
Staatsolie’s 2017 program supports our strategic<br />
goal of securing new reserves to sustain<br />
production, supporting VISION 2030, with plans<br />
structured to identify drill locations for 2018 in<br />
order to make a discovery, with research projects<br />
planned to further de‐risk the areas of interest to<br />
identify drillable prospects. An Environmental and<br />
Social Impact Assessment will be performed in<br />
light of the coming exploration acquisitions in the<br />
nearshore area, to enable execution of a drilling<br />
program should partnerships be formalized in 2017.<br />
Crude Production<br />
At the start of <strong>2016</strong>, the production drilling<br />
program was drastically reduced to ensure cashconservation,<br />
necessitated by the persistent low<br />
oil price and Staatsolie’s challenging financial<br />
position at the time. This resulted in a later start<br />
of the drilling program, initially with only one rig<br />
and two more added in the third quarter, average<br />
daily production declined significantly. In addition,<br />
due to a long rainy season, large sections of the<br />
Tambaredjo field were flooded, which caused a<br />
further drop in production due to a temporary halt<br />
in daily inspections and well maintenance in these<br />
flooded areas.<br />
After an initial halt, the drilling program was<br />
restarted with an initial target of 30 wells. With<br />
Staatsolie successfully achieving its refinancing<br />
and with a higher oil price in the second half of<br />
the year, 64 wells were eventually completed<br />
across the year, with 43 producing wells drilled<br />
in Tambaredjo North West and 21 in Tambaredjo.<br />
And despite the challenges, Staatsolie’s Upstream<br />
team managed to achieve a high success ratio of<br />
close to 90% through a close focus on the geology.<br />
This success was a testament to the skills of<br />
our sub‐surface teams and also was evidence of<br />
the success of co‐locating teams under the new<br />
asset based business structure, enabling closer<br />
co‐operation and greater efficiency. We will build on<br />
this in 2017 and beyond. We started <strong>2016</strong> at 17,012<br />
BOPD and ended 31 December <strong>2016</strong> at 16,361<br />
BOPD, with an average across all fields over the<br />
year of 16,327 BOPD, equating to a total production<br />
of 5.98 MMbbls. This was only a 4% reduction in<br />
production from our target, despite shifting our<br />
maintenance programs to year end. In addition,<br />
we enhanced our efficiency and compared to<br />
2015 reduced our cash cost per barrel with 46% to<br />
US$ 14 per barrel, an excellent achievement and<br />
in line with our goal to be a lowest cost quartile<br />
producer.<br />
Production in 2017<br />
In 2017, we aim to return to a 17,000 bpd average<br />
through an aggressive drilling program. With 141<br />
new producing wells planned from a schedule of 183<br />
drills, this will be Staatsolie’s largest ever program.<br />
To achieve our 17,000 bpd production target, we will<br />
draw on the increased skills of our co‐located teams<br />
and use five rigs, while also ensuring we remain<br />
1
Annual REPORT<br />
Confidence in Our Own Abilities<br />
16<br />
absolutely focused on our number one priority<br />
– the safety of everyone who works with us. We<br />
will also take steps to introduce more ‘smart field’<br />
technology to enhance efficiency and even further<br />
reduce per barrel cost, including a greater use<br />
of on‐ site sensors and monitoring equipment,<br />
which also means less employee activity onsite,<br />
further reducing health and safety risks.<br />
Enhancing Recovery and Production<br />
In addition to our aggressive drilling program<br />
planned for 2017, we will continue to explore<br />
new ways to enhance oil recovery and increase<br />
production. This includes piloting two horizontal<br />
wells. These two wells aim to test the producibility<br />
of reservoirs with oil/water contacts within<br />
Tambaredjo. They will investigate the ability to<br />
increase production and reduce costs by drilling<br />
horizontally for greater reservoir access from the<br />
one well. We anticipate the results of our pilot<br />
tests in 2018, after 6 months of production from<br />
each pilot. We plan to drill a second well to assess<br />
the feasibility of the downhole watersink Enhanced<br />
Oil Recovery method. The first pilot well revealed<br />
technical feasibility; however, commercial<br />
feasibility still has to be assessed, which the<br />
second well should determine. Finally, the results<br />
of our Polymer Flooding pilot to increase production<br />
of nearby wells will be reviewed. Currently for<br />
commercial application, costs exceed per barrel<br />
prices; however, we will investigate whether cost<br />
reductions can be achieved to make the technique<br />
commercially viable.<br />
Uitkijk Joint Venture<br />
Due to the significant drop in the oil price, the<br />
development of the finds in the Uitkijk Block<br />
was not feasible. Accordingly, POC and partner<br />
Portsea relinquished the Uitkijk Block in <strong>2016</strong>.<br />
Institutional activities<br />
Growth can only be sustained by an increase<br />
in production coupled with sufficient reserves<br />
replacement. In addition to our onshore and<br />
nearshore operations and outlook, we are very<br />
excited by the prospectivity of the Guiana Basin<br />
where the Liza commercial discovery was made<br />
in offshore Guyana in 2015. Combined with the<br />
previous discovery in Zaedyus in offshore French<br />
Guiana, it has boosted interest in the basin, even at<br />
a time when the oil business has taken a downturn.<br />
According to the United States Geological Survey,<br />
the Guiana’s Basin is one of the least surveyed<br />
geological areas in the world. Potential petroleum<br />
and gas reserves are estimated at 15 billion barrels<br />
and 42 billion cubic feet respectively.<br />
Open Door Invitation<br />
In <strong>2016</strong>, Staatsolie, as regulator, continued<br />
to promote offshore Suriname via the “Open<br />
Door Invitation”. Closed on 7 September <strong>2016</strong>,<br />
this process encouraged several international oil<br />
companies to bid on Suriname’s open offshore<br />
blocks. As a result we are progressing in the PSC<br />
negotiations regarding offshore blocks 59 and 60.<br />
In line with our Vision 2030 strategy, we aim to<br />
have at least 50% of Suriname’s offshore acreage<br />
under PSC’s by 2020.<br />
Offshore Operations<br />
Currently 8 international oil companies are active<br />
in the offshore. In <strong>2016</strong>, Malaysian Petronas and<br />
its German partner Deutsche Erdoel AG (DEA)<br />
drilled the Roselle‐I exploration well in Block 52.<br />
Drilling took place up to a depth of 5,000m. In<br />
Block 58, Apache executed a 3D seismic survey of<br />
6,245km 2 ‐ across the entire block. In Block 42, a<br />
6,185 km 2 3D seismic survey was acquired by<br />
Kosmos Energy, Chevron and Hess. It is anticipated<br />
that exploration drilling in these blocks will<br />
commence in 2018. Drop‐core studies on blocks<br />
47 and 54 were also undertaken by Tullow, the<br />
operator of these blocks. Following seismic data<br />
processing, it is anticipated that contractor parties<br />
in Block 54 will also drill a well in the fourth quarter<br />
of 2017. Block 31 was relinquished by Teikoku.<br />
Downstream<br />
Refining Operations<br />
The expanded refinery was commissioned at the<br />
end of 2015. Our focus in <strong>2016</strong> was ramping up<br />
output and ensuring our team is equipped with the<br />
skills and support required to operate a plant of<br />
this scale and complexity.<br />
In the first half of <strong>2016</strong>, our team overcame a<br />
number of challenges, including inconsistent<br />
power supply, resulting in power dips causing<br />
refinery trips as well as various equipment failures.<br />
To achieve stable power supply the following<br />
actions were taken:<br />
• Implementation of dual source delivery from<br />
Staatsolie Power Company Suriname N.V.
Annual REPORT<br />
Confidence in Our Own Abilities 17<br />
(SPCS) and the national power company (EBS);<br />
• Adjustments to control settings at the<br />
refinery;<br />
• Full review of the SPCS operational activities;<br />
• Replacement of critical equipment in the<br />
refinery that was too sensitive to power<br />
fluctuations.<br />
Regarding equipment failure among others,<br />
additional guidelines were implemented to<br />
prioritize maintenance jobs based on risks.<br />
With respect to shortening the learning curve,<br />
after a midyear evaluation, significant adjustments<br />
were made to the subject matter experts pool,<br />
aligning them with identified areas of challenges.<br />
All of these adjustments enabled us to end <strong>2016</strong> in<br />
a vastly improved position compared to the year’s<br />
start as we achieved our highest ever monthly<br />
production in December <strong>2016</strong>. The realization<br />
of high end products (diesel and gasoline) was<br />
1.8 MMbbls, 71% of the 2.5 MMbbls target set<br />
for <strong>2016</strong>. We are confident that, as a result of<br />
the actions we took in <strong>2016</strong> at the refinery as<br />
mentioned above, we are in a position to achieve<br />
our 2017 targets. Our 2017 target is an average<br />
utilization of 79% of the installed capacity for high<br />
end products. To further support 2017 targets,<br />
we will have a gap analysis conducted and<br />
implement the recommendations. We will also<br />
have a technical review of the design carried out<br />
by a dedicated engineering group. In addition,<br />
we will have an instrumentation manufacturer<br />
provide hands‐on and classroom training for our<br />
workforce to effectively transfer knowledge in<br />
order to effectively correct equipment issues.<br />
Marketing<br />
Total sales of petroleum products including<br />
trading and after elimination of intra‐company<br />
sales amounted to 5.9 MMbbls, a decrease of 21%<br />
compared to 2015. This was mainly the result of<br />
a 44% decrease in trading revenues, largely due<br />
to the discontinuation of imports of petroleum<br />
products from Petróleos de Venezuela S.A. as of<br />
October 2015. The latter was planned when the<br />
refinery would come on stream.<br />
Staatsolie Power Company Suriname N.V. (SPCS)<br />
SPCS supplies electrical energy to both the<br />
adjacent Staatsolie refinery and the Government<br />
of Suriname, the latter through the national power<br />
company (EBS) grid. To maintain production the<br />
refinery requires a stable, reliable electricity<br />
supply with no tolerance for power interruptions.<br />
An islanding system isolating the refinery supply<br />
from the EBS grid at the onset of any disturbances<br />
in the grid, was commissioned in April <strong>2016</strong>. Up<br />
to that time the refinery was fed in island mode in<br />
permanent isolation from the EBS grid. To address<br />
power outages related to equipment failures and/<br />
or human error, a Reliability Improvement Program<br />
was started at SPCS focusing on Plant, People<br />
and Procedures. This program will aid in improving<br />
the reliability of supply for the refinery to help it<br />
meet its 2017 production targets.<br />
In <strong>2016</strong>, the powerplant delivered 82,000 MWh of<br />
electrical energy and 37,165 ton process steam<br />
to the refinery. A new boiler was successfully<br />
commissioned in November, replacing the initially<br />
installed boiler that had been destroyed by a fire in<br />
2014. This substantially increased our steam output.<br />
Largely due to power supply issues, total<br />
revenues from electrical energy fell by 7.1% from<br />
US$ 53.9 million in 2015 to US$ 50.1 million in<br />
<strong>2016</strong>. Due to a steam production increase of about<br />
12,000 tons compared to 2015, total revenues from<br />
steam sales increased by 41.6% to US$ 510,000.<br />
Ventrin Petroleum Company Limited, Trinidad<br />
The year <strong>2016</strong> was challenging for Ventrin. The<br />
company recorded a loss of US$ 1.2 million, mainly<br />
attributable to claims from off‐spec delivered<br />
products at the end of 2015. Based on expected<br />
increased demand, due to a large competitor<br />
moving out of the market, Ventrin hired a second<br />
barge. Expected increased demand eventually<br />
did not materialize and the barge was released<br />
in September <strong>2016</strong>. Sales in <strong>2016</strong> were 194,500<br />
Metric Tonnes (MT) which was 44,000 MT higher<br />
than in 2015. We estimate sales volumes in 2017 to<br />
be 168,000 MT, this is 26,500 MT less than <strong>2016</strong>,<br />
due to the re‐entry of a large competitor to the<br />
bunkering market. We expect similar sales volumes<br />
going forward <strong>annual</strong>ly. For 2017 the target is to<br />
realize a positive net result.<br />
GOw2 Energy Suriname N.V. (GOw2)‐Retail<br />
Since the acquisition by Staatsolie in 2011, GOw2 has<br />
expanded its services from selling fuel, to marketing<br />
a retail shop concept. GOw2 supplies aviation fuel,<br />
sells lubricants and operates a car service shop. In<br />
<strong>2016</strong>, GOw2 experienced a reduction in its market<br />
share compared to 2015. This was largely attributable<br />
to Staatsolie’s refinery production challenges in <strong>2016</strong>.
Annual REPORT<br />
Confidence in Our Own Abilities<br />
18
Annual REPORT<br />
Confidence in Our Own Abilities 19<br />
Pipelines in the wetlands to transport the crude from well to treatment plant.
Annual REPORT<br />
Confidence in Our Own Abilities<br />
20<br />
Despite the challenges, successes in <strong>2016</strong><br />
included a two‐year extension to our aviation<br />
supply contract with Air France‐KLM and the<br />
re‐building of our GOw2 Tourtonne service station<br />
and pit stop. In addition, our total lubricants market<br />
share increased in <strong>2016</strong>. Although GOw2’s overall<br />
total market share decreased in <strong>2016</strong>, the branded<br />
service stations had an increase in both diesel<br />
and gasoline sales compared to the previous year,<br />
evidence of the success of the earlier rebranding<br />
exercise.<br />
In 2017, we plan to increase our fuel market share<br />
depending on refinery supply and increase our<br />
lubricants division market share by reorganizing<br />
the lubricants department.<br />
Merian Gold Mine<br />
On 1 October <strong>2016</strong>, we celebrated the<br />
commencement of commercial gold production<br />
at the Merian gold mine. The Merian gold mine is<br />
a very exciting project for Staatsolie: following<br />
an investment of US$ 306 million, Staatsolie<br />
is entitled to almost 1.4 million troy ounces,<br />
approximately 44,000 kilograms of the proven<br />
reserves at 5.7 million troy ounces (an increase<br />
on the initial reserves estimate of 4.2 million). At<br />
an average price of US$ 1,300 per troy ounce,<br />
our entitlement is translated to the equivalent of<br />
over US$ 1.8 billion of revenues for the 13 years<br />
the mine will be in production. It is anticipated<br />
that in the first five years, Merian will produce<br />
between 400 and 500 thousand troy ounces of<br />
gold <strong>annual</strong>ly. Participation in the project boosts<br />
the long‐term US dollar earning capacity of<br />
Staatsolie, with earned income to be allocated to<br />
debt reduction and Upstream investment.<br />
Our People<br />
Resource Planning and Culture<br />
In <strong>2016</strong>, our focus was to continue to embed our<br />
asset based management business structure. We<br />
are working hard to ensure all Staatsolie employees<br />
take ownership of their role and understand how<br />
they contribute to our success as a business. This<br />
starts with everyone understanding that we expect<br />
consistent ways of working across the business, in<br />
accordance with our values.<br />
In accordance with our asset based strategy, each<br />
of our four assets are being empowered to create a<br />
reward and benefits structure that best motivates<br />
employees in the context of that asset, to further<br />
embed a culture of responsibility and efficiency.<br />
1<br />
In 2017, structuring these reward and incentive<br />
schemes and appropriately linking them to each<br />
asset’s KPI’s will be the business focus – with<br />
safety remaining our number one priority.<br />
To support our people goals, in 2017 we will also roll<br />
out a culture change program for our management<br />
team and their direct reports, which will afterwards<br />
be cascaded down to our employees. Through<br />
this program, we are seeking to ensure that the<br />
goals of our asset management strategy are lived<br />
in all our day‐to‐day and strategic activities, with<br />
accountability at the core.<br />
Health, Safety, Environment & Quality<br />
The health and safety of our employees and<br />
contractors is at the core of all our activities – no<br />
one should suffer from an injury when working<br />
with us. To ensure rigor, Staatsolie’s business<br />
processes are carried out in accordance with<br />
the ISO 9001:2008 quality management system.<br />
Likewise, prudent national and international<br />
industry standards and practices are implemented<br />
to maintain a safe and healthy work environment.<br />
Projects are carried out in accordance with Health,<br />
Safety & Environmental guidelines, rules and<br />
regulations In <strong>2016</strong>, our focus on HSE continued<br />
to be zero harm to people, environment and the<br />
community, and the development of structures<br />
that will enable our workforce to achieve this.<br />
To achieve zero harm, we believe culture is at the<br />
heart of this, supported with appropriate processes<br />
that are understood and followed. Fundamentally,<br />
we seek a workforce that deeply cares for each<br />
other and takes responsibility for their own and<br />
others wellbeing. To embed this culture, in <strong>2016</strong><br />
we continued with our health, safety, environment<br />
& community (HSEC) days. This year the theme<br />
was “Let HSEC be part of our culture”. Care for our<br />
workforce’s safety includes our contractors as well<br />
as our employees. Our Contractor Management<br />
Guidelines are being incorporated into our key<br />
contracts, with an overall Contractor Management<br />
Program to be established in 2017.<br />
Our Community<br />
Contributing<br />
We take our corporate social responsibility<br />
seriously. We demonstrated this over the<br />
past years by contributing to a wide range of<br />
community projects in education, culture, sports,<br />
health, safety, environment, and projects for the<br />
underprivileged.
Annual REPORT<br />
Confidence in Our Own Abilities 21<br />
Our people will enable<br />
Staatsolie to not only get<br />
through a challenging time<br />
in our market, but emerge<br />
a stronger, more efficient<br />
and resilient company.<br />
A refinery operator at work.
Annual REPORT<br />
Confidence in Our Own Abilities<br />
22<br />
Beyond providing employment and generating<br />
business in our industry, we are committed to<br />
helping bring important community services<br />
to the citizens of Suriname. In <strong>2016</strong>, we were<br />
particularly pleased to officially open the new<br />
Neonatal and Pediatric Intensive Care Units at the<br />
Academic Hospital, which was supported by a US$<br />
500,000 Staatsolie donation, and US$ 700,000<br />
from the Staatsolie Foundation for Community<br />
Development. In the past, due to limited facilities,<br />
the hospital was unable to treat all preterm or<br />
seriously ill babies. With the new units, none since<br />
opening have been turned away due to lack of<br />
facilities – saving the lives of dozens of children<br />
to date, and this will continue in the decades<br />
ahead. In addition to this important facility, and<br />
despite the financial challenges of <strong>2016</strong>, we also<br />
supported the opening of a youth dental care<br />
clinic at Domburg.<br />
Community Engagement<br />
In <strong>2016</strong>, we continued to facilitate meetings with<br />
community members and surrounding companies<br />
to gather information, to communicate, and to<br />
enable the airing of concerns about Staatsolie’s<br />
operations. In <strong>2016</strong>, these meetings included<br />
addressing issues related to the start‐up activities<br />
of our refinery, meetings with landowners in the<br />
light of our Development Drilling Program for <strong>2016</strong><br />
at Saramacca, and meetings held with the District<br />
Commissioner of Saramacca and representatives<br />
of the communities and farmers of the surrounding<br />
areas to discuss flooding and possible solutions,<br />
which we hope to enact together in 2017.<br />
To add additional consistency to our approach<br />
across our operations, we intend to implement<br />
stakeholder engagement guidelines in 2017. We<br />
plan to bring these guidelines to life through<br />
developing amongst others Neighborhood<br />
Councils to act as organized, structured forums<br />
for more consistent community engagement and<br />
communication, in the spirit of true collaboration.<br />
Corporate Social Responsibility<br />
In 2017, we intend to add additional rigor to our<br />
Corporate Social Responsibility (CSR) program<br />
by developing a CSR policy. The policy should be<br />
in place by the end of 2017.<br />
Our social license to operate depends upon<br />
the ongoing support of the communities which<br />
host our operations. For this reason, in <strong>2016</strong> we<br />
continued to enhance how we listen to, engage<br />
with, and reflect the views of these communities.<br />
We will continue to advance our approach in<br />
2017 and focus our activities on supporting<br />
the communities that are most affected by our<br />
operations, since these communities host us.<br />
We will work together with the communities in<br />
2017 and beyond to address their needs in the<br />
manner most effective to them, if needed together<br />
with the local Government.<br />
In addition to these specific concerns, our goal<br />
is to ensure that we help these communities on<br />
their own journey of sustainability, providing them<br />
with the guidance and tools to create economic<br />
opportunities that can sustain them beyond the<br />
life of our operations.<br />
Our Environment<br />
Staatsolie is committed to minimize its<br />
environmental footprint as much as possible.<br />
Staatsolie has adopted nationally and<br />
internationally accepted guidelines and standards<br />
demonstrating the company’s commitment to<br />
prevent or to minimize any adverse impact on<br />
the environment that may be caused by our<br />
operations, supported by practical steps in the<br />
field. For example, when dykes are constructed,<br />
the necessary culverts are placed to prevent<br />
impacts on the hydrology. We also include ample<br />
crossings or openings in dams within the wetland<br />
areas where we operate. Regular monitoring of<br />
environmental parameters such as water and<br />
air quality is also undertaken. Our commitment<br />
towards environmentally responsible operations<br />
is practiced by the execution of an Environmental<br />
and Social Impact Assessment (ESIA) for any new<br />
or expansion project or operations, followed by<br />
implementing the required measures as stated in<br />
the Environmental Management Plans to minimize<br />
the identified impacts. Regular monitoring is being<br />
done to detect early warnings which are used to<br />
provide our management team with guidance<br />
to prevent deterioration of the quality of the<br />
environment.<br />
In <strong>2016</strong>, we:<br />
• Submitted an addendum to our EISA study<br />
of Tambaredjo North West Production<br />
Development to NIMOS to obtain an advice<br />
for expanding the oilfield with additional wells<br />
between <strong>2016</strong> and 2018.<br />
• Submitted an Environmental Evaluation of<br />
the impacts on hydrology in the Tambaredjo<br />
North Area to NIMOS to obtain an advice for<br />
Production Development.
Annual REPORT<br />
Confidence in Our Own Abilities 23<br />
Managing Director Rudolf Elias and Finance Minister Gillmore Hoefdraad<br />
visited the Noble Bob Douglas.<br />
• Submitted 5 Environmental Compliance<br />
Reports of the Tambaredjo North West<br />
Oilfield to NIMOS.<br />
In 2017, we plan to undertake inventory of CO 2<br />
emissions of our Upstream operations. In addition,<br />
we plan to implement an air quality monitoring<br />
program at our Jossie Treatment Plant; a waste<br />
management plan will also be developed and<br />
implemented.
Annual REPORT<br />
Confidence in Our Own Abilities<br />
24
Annual REPORT<br />
Confidence in Our Own Abilities 25<br />
Production drilling in the Tambaredjo-Northwest oilfield.
Annual REPORT<br />
Confidence in Our Own Abilities<br />
26<br />
IV Management’s Analysis of<br />
Operations and Financial Condition<br />
Nearshore exploration drilling activities.<br />
1 Risks and Uncertainties<br />
Staatsolie is exposed to several risks that could<br />
affect our operational and financial performance.<br />
The Staatsolie Enterprise Risk Management<br />
system is implemented in order to ensure safe<br />
operations and to realize our corporate goals. In<br />
this paragraph the key risks are discussed.<br />
Risks related to our Business<br />
1 Market Risk<br />
• A prolonged decline in oil prices will<br />
adversely affect our business, the results<br />
of our operations, our financial condition,<br />
our liquidity and our ability to finance<br />
planned capital expenditure. The effects of<br />
fluctuations in oil prices are monitored and<br />
where necessary decisions are taken to<br />
assure business continuity.<br />
2 Operational Risks<br />
• Failure to find and develop additional oil<br />
reserves: unless we conduct successful<br />
exploration and development activities, our<br />
proved reserves and crude production will<br />
decline. The reserves data are estimates.<br />
Every two years the reserves are validated by<br />
a reputable independent third party.<br />
• Risks in the production operations, refining<br />
operations and sales and distribution may<br />
lead to financial losses. For example pipeline<br />
rupture and no power supply to the refinery.<br />
A set of controls is in place. The effectiveness<br />
of these controls is systematically reviewed<br />
and where necessary improved.<br />
• Health, Safety and Environmental (HSE)<br />
risks could disrupt operations: HSE risk<br />
assessments are conducted, resulting in<br />
environmental management plans and health<br />
& safety plans.<br />
• Failure to attract and retain key employees can<br />
affect the successful implementation of our<br />
strategy. Our human resource management<br />
system includes the determination of key<br />
positions, succession planning, workforce<br />
planning and development of competencies.<br />
3 Financial Risks<br />
• Risks related to the execution of the<br />
investment program: key performance<br />
indicators are defined and monitored via the<br />
Staatsolie Performance Scorecard.<br />
• In case of a property damage or claim:<br />
Staatsolie maintains insurance with proper<br />
coverage in case of physical damage to its<br />
properties, claims from third parties and<br />
accidents to its employees. Regular valuation<br />
and risk surveys are performed by an<br />
independent surveyor. Also regular evaluation<br />
of the content of the insurance coverage is<br />
done by Staatsolie and its insurance brokers.<br />
• Credit, interest and liquidity risks: Credit
Annual REPORT<br />
Confidence in Our Own Abilities 27<br />
terms and credit limits are determined and<br />
monitored. A financial model, whi ch is<br />
reviewed periodically, is used to continuously<br />
monitor our financial position. Currency<br />
translation and transaction risk: Staatsolie<br />
minimizes SRD cash exposure by managing<br />
the SRD revenues versus SRD expenses,<br />
whereby local suppliers are paid in SRD.<br />
4 Political and Economic Risks<br />
• Political and economic policies of the<br />
Surinamese government may have an<br />
impact on our business through e.g. tax and<br />
environmental laws and regulations.<br />
• The Surinamese government is the sole<br />
shareholder of Staatsolie and may cause us<br />
to pursue certain macroeconomic and social<br />
objectives which may affect our results and<br />
financial position. Access to international<br />
capital markets is influenced by the country<br />
risk grade which may impact our ability to<br />
finance our operations.<br />
5 Reputational Risk<br />
• Failure to meet our ethical standards and<br />
non‐compliance with applicable laws and<br />
regulations could harm our reputation and<br />
our business: With our Code of Conduct,<br />
which applies to all employees and others<br />
who act on our behalf, we wish to firmly<br />
establish the specific values of integrity and<br />
community spirit.<br />
2 Critical Accounting Policies<br />
The preparation of financial statements in<br />
conformity with U.S. Generally Accepted<br />
Accounting Principles (US GAAP) requires<br />
management to make estimates and judgments<br />
that affect the reported amounts of assets,<br />
liabilities, revenues and expenses and the<br />
disclosure of contingent assets and liabilities. The<br />
following summary provides further information<br />
about the critical accounting policies and the<br />
judgments that are made by the Company in the<br />
application of those policies.<br />
Oil Reserves<br />
Evaluation of oil reserves is important to the effective<br />
management of upstream assets. It is integral to<br />
making investment decisions about oil properties<br />
such as whether development should proceed. Oil<br />
reserve quantities are also used as the basis for<br />
calculating unit of production depreciation rates. Oil<br />
reserves include both proved and unproved reserves.<br />
Proved oil reserves are those quantities of oil,<br />
which, by analysis of geoscience and engineering<br />
data, can be estimated with reasonable certainty<br />
to be economically producible – from a given<br />
date forward, from known reservoirs, and under<br />
existing economic conditions and operating<br />
methods. Unproved reserves are those with less<br />
than reasonable certainty of recoverability and<br />
include probable and possible reserves. Probable<br />
reserves are reserves that are more likely to be<br />
recovered than not. Possible reserves are those<br />
unproved reserves which analysis of geological<br />
and engineering data suggests are less likely to be<br />
recoverable than probable reserves.<br />
The estimation of proved reserves, which is based<br />
on the requirement of reasonable certainty, is<br />
an ongoing process based on rigorous technical<br />
evaluations, commercial and market assessment,<br />
and detailed analysis of well information such as<br />
flow rates and reservoir pressure declines.<br />
Reserve changes (revisions) are made within a<br />
well‐established, disciplined process driven by<br />
geoscience and engineering professionals.<br />
Revisions can include upward or downward changes<br />
in previously estimated volumes of proved reserves<br />
for existing fields due to:<br />
1. Change in reservoir performance;<br />
2. Change in production technology;<br />
3. New geologic, reservoir or production data;<br />
4. Changes in prices and costs that are used in<br />
the estimation of reserves;<br />
5. Revised reservoir model.<br />
Although Staatsolie is reasonably certain that<br />
proved reserves will be produced, the timing and<br />
amount recovered can be affected by a number<br />
of factors including completion of development<br />
projects, reservoir performance and significant<br />
changes in long‐term oil price levels.<br />
Proved reserves can be further subdivided into<br />
developed and undeveloped reserves. The proved<br />
developed reserves have been over 50 percent for<br />
more than five (5) years. This indicates that proved<br />
reserves are consistently moved from undeveloped<br />
to developed status, as new wells are drilled and<br />
facilities to collect and deliver the production from<br />
those wells are installed.<br />
Development projects typically take two (2) to five<br />
(5) years from the time of recording proved reserves<br />
1
Annual REPORT<br />
Confidence in Our Own Abilities<br />
28<br />
to the start of production from these reserves.<br />
However, a longer time frame is applied where<br />
reserves are only developed until actually required<br />
to meet the Company’s production target.<br />
Staatsolie uses the “successful efforts” method<br />
to account for its exploration and production<br />
activities. Under this method, costs are<br />
accumulated on a field by field basis with certain<br />
exploratory expenditures and exploratory dry<br />
holes being expensed as incurred. Costs of<br />
economic productive wells, development dry<br />
holes, other wells drilled to support development<br />
of the field (e.g. observation wells, injection wells,<br />
delineation wells etc.) and production equipment<br />
are capitalized and amortized based on the Unit of<br />
Production Method (UPM).<br />
Impairment<br />
Oil reserves are used in assessing oil producing<br />
properties for impairment. A significant reduction<br />
in the estimated reserves of a property would<br />
trigger an impairment review. Proved reserves are<br />
used to estimate future production volume in the<br />
cash flow model.<br />
Impact of Oil Reserves on Depreciation<br />
The calculation of Unit of Production depreciation<br />
is a critical accounting estimate that measures<br />
the depreciation of upstream assets. It is the ratio<br />
of actual year volumes of crude produced to total<br />
proved developed oil reserves.<br />
Suspended Exploratory Well Costs<br />
In accordance with US GAAP, costs for exploratory<br />
wells are initially recorded as tangible assets under<br />
projects in progress, pending the determination<br />
of whether the well has found proved reserves.<br />
If proved reserves are found, the recorded costs<br />
of drilling the well are reclassified to evaluated<br />
properties and amortized on a Unit of Production<br />
method. If proved reserves are not found, the<br />
capitalized costs of drilling the well are charged to<br />
expense. However, successful exploratory efforts<br />
are, in many cases, not declared to be proved<br />
until after an extensive and lengthy evaluation<br />
period has been completed. Staatsolie continues<br />
to record the costs of exploratory well when (a)<br />
the well has found a sufficient oil column for<br />
completion of the well to justify its completion<br />
as a producing well; and (b) Staatsolie is making<br />
sufficient progress in assessing the reserves and<br />
the economic and operating viability of the project.<br />
1<br />
Exploratory well costs not meeting these criteria<br />
are charged to expense. Determination of whether<br />
an exploratory well should remain recorded under<br />
projects in progress requires a high degree of<br />
judgment on the part of management and requires<br />
careful consideration of the relevant facts and<br />
circumstances. Management reviews suspended<br />
exploratory well cost balances semi‐<strong>annual</strong>ly,<br />
continuously monitors the results of the additional<br />
appraisal drilling and seismic work, and charges<br />
to expense the suspended well costs as dry holes<br />
when it judges the potential field does not warrant<br />
further investment in the near term.<br />
Dismantlement and Abandonment Obligation<br />
Provisions are recognized for the future<br />
dismantlement and abandonment of the<br />
production field, the related facilities, pipelines,<br />
the refinery and the power plant. The calculation<br />
is based on the cash value of the estimated full<br />
cost, taking into account assumptions regarding<br />
the rate of inflation. Furthermore, the calculation<br />
of the estimated full cost is based on the fact<br />
that the dismantlement and abandonment will be<br />
performed by Staatsolie.<br />
Pensions and Other Postretirement Benefits<br />
The provision for pensions and other postretirement<br />
benefits is based on assumptions which are used<br />
in an actuarial evaluation. Pension accounting<br />
requires explicit assumptions regarding, among<br />
others, the expected return on plan assets,<br />
the discount rate for benefit obligations and<br />
the rate for inflation and salary developments.<br />
The assumptions are reviewed <strong>annual</strong>ly by<br />
management and adjusted as appropriate.<br />
The actuarial evaluation is performed by an<br />
independent actuarial firm.<br />
Litigation Contingencies<br />
As at December 31, <strong>2016</strong> there are pending lawsuits<br />
against Staatsolie and its consolidated subsidiary<br />
GOw2 Energy Suriname N.V. Management has<br />
regular litigation reviews, including updates from its<br />
Corporate Legal Affairs and their external lawyers<br />
to assess the need for accounting recognition or<br />
disclosure of these contingencies. In accordance<br />
with US GAAP criteria for contingencies, it is<br />
required that liabilities for contingencies are<br />
recorded only if it is probable that a liability has<br />
been incurred at the date of the balance sheet<br />
and if the liability incurrence can be reasonably<br />
estimated. These estimated amounts for the<br />
1
Annual REPORT<br />
Confidence in Our Own Abilities 29<br />
Fuel trucks at te GOw2 terminal in Paramaribo.<br />
liability incurrence are not reduced by amounts<br />
that may be recovered under insurance or claims<br />
against third parties. Undiscounted receivables<br />
from insurers or other third parties may be accrued<br />
separately. Staatsolie revises such accruals in<br />
light of new information or developments, if any.<br />
Based on a consideration of all relevant facts and<br />
circumstances, Staatsolie does not believe that<br />
the ultimate outcome of any currently pending<br />
lawsuit against Staatsolie and its subsidiary<br />
GOw2 Energy Suriname N.V. will have a material<br />
adverse effect upon Staatsolie’s operations,<br />
financial condition, or financial statements taken<br />
as a whole.<br />
Tax Contingencies<br />
Staatsolie and its subsidiaries are subject<br />
to income taxation. Significant management<br />
judgment is required in the accounting for income<br />
tax contingencies and tax disputes because the<br />
outcomes are often difficult to predict.<br />
US GAAP requires recognition and measurement<br />
of uncertain tax positions that the company has<br />
taken or expects to take in its income tax returns.<br />
The benefit of an uncertain tax position can<br />
only be recognized in the financial statements if<br />
management concludes that it is more likely than<br />
not that the position will be sustained with the tax<br />
authorities.
Annual REPORT<br />
Confidence in Our Own Abilities<br />
30
Annual REPORT<br />
Confidence in Our Own Abilities 31<br />
Casing storage on board of the Noble Bob Douglas.
Annual REPORT<br />
Confidence in Our Own Abilities<br />
32<br />
V Independent<br />
Auditor’s Report<br />
To the Shareholder, Supervisory Board, Board of<br />
Executive Directors and Management of Staatsolie<br />
Maatschappij Suriname N.V., Paramaribo<br />
Report on the Financial Statements<br />
We have audited the accompanying financial<br />
statements <strong>2016</strong> of Staatsolie Maatschappij<br />
Suriname N.V., Paramaribo, which comprise<br />
the consolidated and company balance sheet<br />
as at December 31, <strong>2016</strong>, the consolidated and<br />
company income statement, the consolidated<br />
statement of changes in shareholder’s equity and<br />
the consolidated statement of cash flows for the<br />
year then ended and notes, comprising a summary<br />
of the significant accounting policies and other<br />
explanatory information.<br />
Management’s Responsibility<br />
Management is responsible for the preparation<br />
and fair presentation of these financial statements<br />
in accordance with accounting principles generally<br />
accepted in the United States of America.<br />
Furthermore management is responsible for such<br />
internal control as it determines is necessary to<br />
enable the preparation of the financial statements<br />
that are free from material misstatement, whether<br />
due to fraud or error.<br />
Auditor’s Responsibility<br />
Our responsibility is to express an opinion on<br />
these financial statements based on our audit.<br />
We conducted our audit in accordance with<br />
International Standards on Auditing. This requires<br />
that we comply with ethical requirements and<br />
plan and perform the audit to obtain reasonable<br />
assurance about whether the financial statements<br />
are free from material misstatement.<br />
In making those risk assessments, the auditor<br />
considers internal control relevant to the entity’s<br />
preparation and fair presentation of the financial<br />
statements in order to design audit procedures<br />
that are appropriate in the circumstances, but<br />
not for the purpose of expressing an opinion<br />
on the effectiveness of the entity’s internal<br />
control. An audit also includes evaluating the<br />
appropriateness of accounting policies used and<br />
the reasonableness of accounting estimates made<br />
by management, as well as evaluating the overall<br />
presentation of the financial statements.<br />
We believe that the audit evidence we have<br />
obtained is sufficient and appropriate to provide a<br />
basis for our audit opinion.<br />
Opinion<br />
In our opinion, the financial statements give a true<br />
and fair view of the financial position of Staatsolie<br />
Maatschappij Suriname N.V. as at December 31,<br />
<strong>2016</strong> and of its result and its cash flows for the<br />
year then ended in accordance with accounting<br />
principles generally accepted in the United States<br />
of America.<br />
Paramaribo, June 30, 2017<br />
Lutchman & Co. Accountants<br />
Drs. M.R.A. Lutchman RA (Chartered Accountant)<br />
An audit involves performing procedures to obtain<br />
audit evidence about the amounts and disclosures<br />
in the financial statements. The procedures<br />
selected depend on the auditor’s judgment,<br />
including the assessment of the risks of material<br />
misstatement of the financial statements, whether<br />
due to fraud or error.
Annual REPORT<br />
Confidence in Our Own Abilities 33<br />
VI Consolidated<br />
Financial<br />
Statements <strong>2016</strong>
Annual REPORT<br />
Confidence in Our Own Abilities<br />
34<br />
1 Consolidated Balance Sheet as at December 31, <strong>2016</strong><br />
(Before distribution of earnings)<br />
ASSETS (x Us$ 1,000) Notes <strong>2016</strong> 2015<br />
Current assets<br />
Cash and cash equivalents 3 39,166 54,064<br />
Short‐term investments 4 3,754 6,910<br />
Trade receivables 5 108,606 118,679<br />
Inventories 6 67,142 71,504<br />
Prepaid expenses and other current assets 7 68,387 52,277<br />
Loan receivable 11 8,368 1,796<br />
295,423 305,230<br />
Investments 8<br />
Participation in Joint Ventures 3,063 3,063<br />
Participation in Suriname Gold Project LLC 305,656 224,901<br />
308,719 227,964<br />
Intangible assets 9 13,881 17,494<br />
Deferred tax asset 10 16,062 10,119<br />
Loan receivable long term 11 14,677 -<br />
Property, plant and equipment 12<br />
Upstream 336,530 313,174<br />
Refining 999,152 1,023,451<br />
Marketing & trading 10,101 10,973<br />
Power plant 101,172 106,963<br />
Corporate & other 37,181 40,440<br />
1,484,136 1,495,001<br />
Projects in progress 132,140 205,166<br />
1,616,276 1,700,167<br />
Total assets 2,265,038 2,260,974<br />
See accompanying notes to consolidated financial statements<br />
Paramaribo, June 30, 2017<br />
The Board of Executive Directors:<br />
R. Elias Managing Director<br />
B. Dwarkasing Upstream Director<br />
A. Jagesar Downstream Deputy Director<br />
A. Moensi‐Sokowikromo Finance Director
Annual REPORT<br />
Confidence in Our Own Abilities 35<br />
L i a b i l i t i e s (x Us$ 1,000) Notes <strong>2016</strong> 2015<br />
Current liabilities<br />
Trade payables 91,994 110,350<br />
Bank overdraft 3,713 2,560<br />
Accrued liabilities 13 87,042 55,349<br />
Income and other taxes payable 14 16,014 13,119<br />
Short‐term portion of loans 16 69,031 64,801<br />
267,794 246,179<br />
Long term liabilities<br />
Bond 15 98,475 98,281<br />
Term Loans 16 591,646 623,191<br />
Other long term liabilities 6,544 6,365<br />
696,665 727,837<br />
Provisions<br />
Dismantlement and abandonment 17 132,933 122,606<br />
Pensions & other postretirement benefits 18 16,037 10,742<br />
Pension plan 19 34,234 31,803<br />
Environmental risk 20 3,016 3,052<br />
186,220 168,203<br />
Shareholder’s equity 1,114,359 1,118,755<br />
Total Liabilities & Shareholder’s equity 2,265,038 2,260,974<br />
See accompanying notes to consolidated financial statements<br />
Paramaribo, June 30, 2017<br />
The Supervisory Board:<br />
E. Boerenveen Chairman<br />
G. Asadang Member<br />
A. Imanuel Member<br />
E. Poetisi Member<br />
M. Rommy Member
Annual REPORT<br />
Confidence in Our Own Abilities<br />
36<br />
2 Consolidated Income Statement <strong>2016</strong><br />
(x US$1,000) Notes <strong>2016</strong> 2015<br />
Revenues from<br />
Production & Refining 156,336 230,454<br />
Trading activities 169,953 301,181<br />
Electric energy 39,035 50,897<br />
Inventory variation (868) 8,562<br />
Other revenues 3,836 208<br />
Gross revenues 24 368,292 591,302<br />
Exploration expenses including dry holes (1,465) (14,157)<br />
Production expenses (44,783) (53,615)<br />
Refinery expenses (54,553) (54,986)<br />
Depreciation/Amortization 25 (100,066) (66,668)<br />
Accretion expenses (7,277) (6,568)<br />
Export‐, transport‐ and sales costs (21,768) (22,188)<br />
Trading & Other operational costs 26 (81,132) (272,311)<br />
Operating income 57,248 100,809<br />
General and administrative expenses (23,509) (33,533)<br />
Expensed projects (1,411) (8,637)<br />
Financial income (expenses) 27 (34,253) (22,364)<br />
Other income (expenses) 6,534 (3,923)<br />
Share in net result of investment Suriname Gold Project CV 8,121 (3,473)<br />
Earnings before tax 12,730 28,879<br />
Income tax charge 28 (7,508) (5,865)<br />
Net profit 5,222 23,014<br />
See accompanying notes to consolidated financial statements<br />
Paramaribo, June 30, 2017<br />
The Board of Executive Directors:<br />
R. Elias Managing Director<br />
B. Dwarkasing Upstream Director<br />
A. Jagesar Downstream Deputy Director<br />
A. Moensi‐Sokowikromo Finance Director<br />
The Supervisory Board:<br />
E. Boerenveen Chairman<br />
G. Asadang Member<br />
A. Imanuel Member<br />
E. Poetisi Member<br />
M. Rommy Member
Annual REPORT<br />
Confidence in Our Own Abilities 37<br />
3 Consolidated Statement of Changes in Shareholder’s Equity<br />
In <strong>2016</strong>, the shareholder’s equity consists of the following:<br />
Common<br />
stock<br />
General<br />
reserve<br />
Appropriated<br />
reserve for<br />
environmental<br />
risk<br />
Appropriated<br />
reserve<br />
Committee<br />
Rehabilitation<br />
and Expansion<br />
of Sports<br />
facilities<br />
Accumulated<br />
net other<br />
comprehensive<br />
income<br />
Total<br />
(X US$ 1,000)<br />
Balance as at January 1, 2015 12,104 1,094,661 7,500 6,009 (17,185) 1,103,089<br />
Equity movements:<br />
Transfer from earnings - 23,091 - - - 23,091<br />
Prepaid pension benefits - (77) - - - (77)<br />
Allocation / (Withdrawal) 1) - 500 (2,649) (5,199) (7,348)<br />
Balance as at January 1, <strong>2016</strong> 12,104 1,117,675 8,000 3,360 (22,384) 1,118,755<br />
Equity movements:<br />
Transfer from earnings - 5,294 - - - 5,294<br />
Prepaid pension benefits - (72) - - - (72)<br />
Currency translation adjustment - - - - (3,158) (3,158)<br />
Allocation/(Withdrawal) 1) - - 500 (744) (6,217) (6,461)<br />
Balance as at December 31, <strong>2016</strong> 12,104 1,122,897 8,500 2,616 (31,759) 1,114,359<br />
See accompanying notes to consolidated financial statements<br />
1) Allocation/ (Withdrawal) consists of the following items:<br />
Allocation to appropriated reserve for environmental risks: US$ 500,000.<br />
Annually, an amount of US$ 500,000 is allocated for environmental risks. As at December 31, <strong>2016</strong>, the appropriated reserve for environmental risks amounted to<br />
US$ 8.5 million.<br />
Withdrawal from appropriated reserve Committee Rehabilitation and Expansion of Sports facilities: (US$ (744,112)).<br />
Withdrawal from accumulated net other Comprehensive Income: US$ (6,217,000). See note 4 for the breakdown of this amount.
Annual REPORT<br />
Confidence in Our Own Abilities<br />
38<br />
4 Consolidated Statement of Other Comprehensive Income<br />
(x US$ 1,000) <strong>2016</strong> 2015<br />
Balance as at January 1 22,384 17,185<br />
Pensions and other postretirement benefits plans 6,556 6,281<br />
Unrealized (gains) and losses short‐term investments 3,156 1,842<br />
Currency Translation adjustment 3,158 -<br />
Tax effects of items included in other comprehensive income (3,496) (2,924)<br />
Balance as at December 31 31,759 22,384<br />
(x US$ 1,000 ) Tax effects related to other comprehensive income <strong>2016</strong><br />
Before Tax Tax Expense/<br />
Net of Tax<br />
amount<br />
Benefit<br />
amount<br />
Pensions and other postretirement benefits plans 6,556 (2,360) 4,196<br />
Unrealized (gains) and losses short‐term investments 3,156 (1,136) 2,020<br />
Other comprehensive income 9,712 (3,496) 6,216<br />
See accompanying notes to consolidated financial statements<br />
(x US$ 1,000) Difference between <strong>2016</strong> company ‐ and consolidated shareholder’s equity<br />
Consolidated shareholder’s equity 1,114,359<br />
Company shareholder’s equity 1,125,120<br />
Difference (10,761)<br />
Due to the following:<br />
Negative net capital value Ventrin (6,784)<br />
Negative net capital value POC (3,977)<br />
Total (10,761)
Annual REPORT<br />
Confidence in Our Own Abilities 39<br />
5 Consolidated Cash Flow Statement <strong>2016</strong><br />
(x US$ 1,000) <strong>2016</strong> 2015<br />
Cash flow from operating activities<br />
Net profit 5,222 23,014<br />
Depreciation 96,452 66,668<br />
Accretion expenses 7,277 6,568<br />
Amortization of debt arrangement fees 3,936 3,373<br />
Amortization of intangible assets 3,615 -<br />
Exploration expenses wells 185 -<br />
Provisions (7,129) (6,449)<br />
Accrued interest (639) 4,988<br />
Deferred taxes - (44)<br />
Foreign exchange (gain)/loss (2,082) (1,433)<br />
Provison for doubtful accounts (162) (2,479)<br />
Other long term liabilities 179 1,283<br />
Operating profit before working capital changes 106,854 95,489<br />
Working capital changes (Operating assets)<br />
Trade receivables and prepaid expenses (5,875) 5,812<br />
Inventories 3,340 (13,035)<br />
Trade payables (20,295) 77,505<br />
Bank overdraft 1,153 (339)<br />
Accrued liabilities 31,265 (59,308)<br />
Income and other taxes 2,895 (19,396)<br />
Pension plan 6,456 4,885<br />
Provision for pensions and other postretirement benefits 6,533 2,858<br />
Net cash flow from operating activities 132,326 94,471<br />
Cash generated from investing activities<br />
Proceeds from sale of property, plant and equipment (124) 34<br />
Loan receivables (21,249) -<br />
Investment in property, plant and equipment (13,047) (248,061)<br />
Investment in intangible assets 3,613 (12,047)<br />
Investment in Suriname Gold Project C.V. (80,755) (96,667)<br />
Net cash flow from investing activities (111,562) (356,741)<br />
Cash generated from financing activities:<br />
Increase/(Decrease) in loan (26,324) 173,959<br />
Increase/(Decrrease) in bond (266) 47,286<br />
Payment of debt arrangement fees (4,468) (4,768)<br />
Increase of provision for environmental risk (36) -<br />
Deferred tax asset (8,417) -<br />
Changes in general reserve 572 1,409<br />
Dividends paid - (15,735)<br />
Committee Rehabilitation and Expansion of Sports facilities (744) (2,649)<br />
Net cash flow from financing activities (39,683) 199,502<br />
Effects of exchange rate changes on foreign cash balances 4,021 1,659<br />
Net increase (decrease) in cash and cash equivalents (14,898) (61,109)<br />
Cash and cash equivalents at the beginning of the year 54,064 115,173<br />
Cash and cash equivalents at the end of the year 39,166 54,064<br />
Interest paid 41,158 29,787<br />
Income tax paid - 21,244<br />
See accompanying notes to consolidated financial statements
Annual REPORT<br />
Confidence in Our Own Abilities<br />
40
Annual REPORT<br />
Confidence in Our Own Abilities 41<br />
Pipeline in the oilfield.
Annual REPORT<br />
Confidence in Our Own Abilities<br />
42<br />
VII Notes to the Consolidated<br />
Financial Statements<br />
General Information<br />
Staatsolie Maatschappij Suriname N.V. (Staatsolie)<br />
is an integrated oil company incorporated in the<br />
Republic of Suriname. The integrated activities<br />
include exploration, production, refining,<br />
marketing and distribution of petroleum products.<br />
Through its subsidiary (SPCS), Staatsolie is<br />
engaged in electric power generation.<br />
Staatsolie has four (4) subsidiaries of which<br />
three (3) wholly owned: Paradise Oil Company<br />
N.V. (POC) and GOw2 Energy Suriname N.V.<br />
incorporated in the Republic of Suriname and<br />
Ventrin Petroleum Company Limited, a bunkering<br />
company incorporated in the Republic of Trinidad<br />
and Tobago.<br />
Staatsolie holds 102,999 out of 103,000 shares<br />
of the Staatsolie Power Company Suriname N.V.<br />
(SPCS), incorporated in the Republic of Suriname,<br />
and the local electricity company N.V. EBS holds<br />
one share. Furthermore, as of November 2014<br />
Staatsolie has a interest of 25% in the Suriname<br />
Gold Project CV (‘Surgold’), a limited partnership<br />
created between Suriname Gold Project Company<br />
LLC and Staatsolie. POC is, at the moment, a<br />
dormant company. In June 2015, the operations<br />
of Paradise Oil Company N.V. (POC) were put on<br />
hold and the company did not have any activity<br />
during the year ending 31 December <strong>2016</strong> or<br />
subsequent to the year end. In the future Paradise<br />
Oil Company N.V. (POC) will participate in Joint<br />
Venture opportunities with third parties.<br />
1 Summary of Accounting Policies<br />
Principles of Consolidation<br />
These consolidated financial statements include<br />
the accounts of subsidiaries for which Staatsolie<br />
has control. The consolidated financial statements<br />
are prepared in accordance with U.S. Generally<br />
Accepted Accounting Principles (US GAAP) for the<br />
oil and gas industries in particular.<br />
The financial data of Staatsolie and its<br />
subsidiaries are consolidated under elimination of<br />
intercompany balances, sales and purchases.<br />
Foreign Currency Transactions and Translation<br />
Until December 31, 2015, the US dollar is the<br />
functional currency and also the reporting<br />
currency of all of the company’s consolidated<br />
operations and its equity investment. Gains and<br />
losses arising from foreign currency denominated<br />
transactions are generally recognized in the current<br />
period income. Gains and losses from currency<br />
remeasurement are included in the current period<br />
income with reference to the applicable buying rates<br />
as published by the Centrale Bank van Suriname.<br />
The cumulative translation effect of a consolidated<br />
subsidiary using functional currency other than<br />
the US dollar are included in ‘Currency translation<br />
adjustment’ on the Consolidated Statement of<br />
Changes in Equity.<br />
Cash and Cash Equivalents<br />
Cash includes not only currency on hand but<br />
demand deposits with banks or other financial<br />
institutions. Cash equivalents are short‐term, highly<br />
liquid investments with maturities of three months<br />
or less when acquired, which have an insignificant<br />
risk of changes in value.<br />
Short‐term Investments<br />
Short‐term investments are stated at market value<br />
and are classified as available‐for‐sale.<br />
The market value of shares is derived from the value<br />
quoted by the ‘Effectenbeurs van Suriname’ (Stock<br />
Exchange of Suriname). The unrealized gains and<br />
losses on short‐term investments, after deduction<br />
of deferred income taxes, are recorded under the<br />
shareholder’s equity. US GAAP allows that the<br />
net unrealized gains and losses on short‐term<br />
investments are recorded in the shareholder’s<br />
equity as part of the accumulated net other<br />
comprehensive income. The sale proceeds of these<br />
securities available‐for‐sale, shall be recorded by a<br />
debit to cash, and a credit to remove the security at<br />
its market value. The other comprehensive income,<br />
representing the unrealized gain or loss at the date<br />
of sale is reversed into earnings, and the deferred<br />
tax accounts are adjusted.<br />
Accounts Receivable<br />
Receivables are recorded at their nominal value<br />
and, if necessary, an allowance is made for doubtful<br />
accounts.<br />
Inventories<br />
Crude oil and refined products’ inventories at<br />
period end are valued at the lower of either cost or<br />
market value. Cost comprises all direct purchase<br />
costs, attributable operating expenses including<br />
depreciation and allocated overhead. Drilling<br />
supplies and other materials are recorded at the<br />
weighted average cost price or lower market value.<br />
The cost price consists of the purchase price plus<br />
an allowance for import and transportation costs.<br />
If necessary, a provision for obsolete inventory is<br />
taken into consideration and deducted from the
Annual REPORT<br />
Confidence in Our Own Abilities 43<br />
inventory. Ordered goods have been recorded<br />
at purchase value and only the goods that are in<br />
transit at balance sheet date are recorded on the<br />
balance sheet.<br />
Participation in Joint Ventures<br />
The participation in Joint Ventures is recorded at<br />
cost.<br />
Equity Investments<br />
Equity investments are accounted for using the<br />
equity method.<br />
Intangible Assets<br />
Goodwill<br />
To the extent that the cost of acquiring an equity<br />
investment exceeds the fair value of the net assets<br />
acquired, the excess is recorded as goodwill. In<br />
general goodwill is evaluated for impairment on at<br />
least an <strong>annual</strong> basis.<br />
Other Intangible Assets<br />
This relates to capitalized computer software with<br />
a finite life which is valued at cost and amortized<br />
on a straightline basis over the estimated useful<br />
life. Capitalized software includes internal and<br />
external costs incurred directly related to the<br />
implementation of the software.<br />
We make judgments about the recoverability of<br />
purchased finite lived intangible assets whenever<br />
events or changes in circumstances indicate that<br />
an impairment may exist. Recoverability of finite<br />
lived intangible assets is measured by comparing<br />
the carrying amount of the asset to the future<br />
discounted cash flows that the asset is expected<br />
to generate. In general other intangible assets are<br />
evaluated for impairment on at least an <strong>annual</strong><br />
basis.<br />
Property, Plant and Equipment<br />
Exploration and Production Development<br />
Staatsolie utilizes the successful efforts method to<br />
account for expenditures incurred on exploration<br />
and production activities. Exploration costs<br />
incurred (drilling costs and material fixed assets)<br />
are initially recorded under Projects in progress,<br />
pending determination of whether the wells found<br />
proved reserves.<br />
If proved reserves are found, the recorded costs<br />
of drilling the well are reclassified to Evaluated<br />
properties and amortized on a UPM basis.<br />
Costs are also recorded under Projects in progress<br />
for exploratory wells that have found crude oil<br />
reserves even if the reserves cannot be classified<br />
as proved when the drilling is completed, provided<br />
that the exploratory wells have found a sufficient<br />
quantity of reserves to justify its completion as<br />
a producing well and the company is making<br />
sufficient progress assessing the reserves and the<br />
economic and operating viability of the project.The<br />
evaluation of the exploratory wells is made twice<br />
a year. Exploratory well costs not meeting these<br />
criteria or if the company obtains information that<br />
raises substantial doubt about the economic of<br />
operational viability of the project, the exploratory<br />
well would be assumed to be impaired, and its<br />
costs, net of any residual value, would be charged<br />
to expense<br />
Oil Properties<br />
The costs of production development such as<br />
drilling, testing and completion of development wells<br />
are capitalized, notwithstanding if these wells are<br />
successful or not. Capitalized costs consist of the<br />
purchase price of materials and services, including<br />
the company’s internal services. Capitalized costs<br />
for wells, equipment and production facilities are<br />
depreciated using the Unit of Production Method.<br />
All costs for development wells, related plant and<br />
equipment, and related asset retirement obligation<br />
(ARO) are capitalized. Capitalized costs relating to<br />
investments in the oil field, including productive<br />
land properties, are depreciated based on the Unit<br />
of Production Method (UPM), generally by individual<br />
field, as the proved developed reserves are<br />
produced. The UPM factor is derived from the year<br />
oil production and the related proved developed oil<br />
reserves.<br />
Refinery, Power Plant and Other Fixed Assets<br />
The refinery, power plant and other fixed assets are<br />
valued at cost. The capitalized costs of these assets<br />
are depreciated on a straightline basis, taking into<br />
account the estimated useful lifetime of the assets.<br />
Projects in Progress<br />
Projects in progress relates to work in progress,<br />
for which at the date of completion the cost is<br />
capitalized to the appropriate category of property<br />
plant and equipment. Project in progress is not<br />
depreciated.<br />
Capitalized Borrowing Cost<br />
Interest costs incurred to finance expenditures
Annual REPORT<br />
Confidence in Our Own Abilities<br />
44<br />
during the construction phase of multiyear<br />
projects are capitalized as part of the historical<br />
cost of acquiring the constructed assets. The<br />
project construction phase commences with the<br />
development of the detailed engineering design<br />
and ends when the constructed assets are ready<br />
for their intended use. Capitalized interest costs<br />
are included in property, plant and equipment and<br />
are depreciated over the service life of the related<br />
assets. Capitalized interest costs can also be<br />
included in equity investments.<br />
Impairment of Property, Plant and Equipment<br />
The carrying values of property, plant and<br />
equipment are reviewed for impairment when<br />
events or changes in circumstances indicate<br />
that the carrying value may not be recoverable.<br />
If any such indication exists and where the<br />
carrying values exceed the estimated recoverable<br />
amounts, the assets of cashgenerating units are<br />
written down to their recoverable amount.<br />
Current Liabilities<br />
This relates to short‐term obligations which are<br />
payable within one year, and are recorded at their<br />
nominal values.<br />
Loan and Debt Arrangement Fees<br />
The term loan and the bonds are recorded at<br />
historical cost. US GAAP requires that debt<br />
arrangement fees which consist of the upfront<br />
fees and consultancy costs should be capitalized<br />
and amortized as expense over the duration of the<br />
loan. The loans are presented net of unamortized<br />
debt arrangement fees. The outstanding balance<br />
of loan which is payable within one (1) year from<br />
the balance sheet date is presented as short‐term<br />
liabilities, and the remaining balance is presented<br />
as long‐term liabilities.<br />
Deferred Income Taxes<br />
Income tax expense comprises both current tax<br />
and deferred tax. Deferred tax assets and liabilities<br />
are recognized for the future tax consequences<br />
attributable to differences between the financial<br />
statement carrying amounts of existing assets<br />
and liabilities and their respective tax bases, and<br />
operating loss and tax credit carry forwards.<br />
Deferred tax assets and liabilities are calculated<br />
using enacted tax rates that will apply to taxable<br />
income in the years in which those temporary<br />
differences are expected to be recovered or<br />
settled. The effect on deferred tax assets and<br />
liabilities of a change in tax rates is recognized in<br />
the period that includes the enactment date. A<br />
valuation allowance is provided if it is more likely<br />
than not that deferred tax assets may not be<br />
realized in full.<br />
In assessing the realizability of deferred tax assets,<br />
management considers whether it is more likely<br />
than not that some portion or all of the deferred tax<br />
assets will not be realized. The ultimate realization<br />
of deferred tax assets is dependent upon the<br />
generation of future taxable income during the<br />
periods in which those temporary differences<br />
become deductible. Management considers the<br />
scheduled reversal of deferred tax liabilities,<br />
projected future taxable income, and tax planning<br />
strategies in making this assessment.<br />
Provision for Dismantlement and Abandonment<br />
/ Asset Retirement Obligations<br />
This provision regards the expected costs of the<br />
dismantlement of the production field, the related<br />
production facilities, the pipelines (SaramaccaTout<br />
Lui Faut), the refinery and the power plant. The<br />
calculation of this provision is based on the cash<br />
value of the estimated full cost, taking into account<br />
an adjustment for inflation.<br />
US GAAP requires that the accretion expense<br />
resulting from the change in the passage of time<br />
in the asset retirement obligation (ARO) should be<br />
recorded as period cost in the income statement<br />
under the operating expenses.<br />
The allocation of the cost for related production<br />
facilities, for example production fields, is based on<br />
the Unit of Production Method.<br />
The allocation of the costs for the other tangible<br />
fixed assets is based on the straightline method.<br />
The period for allocation is based on the expected<br />
moment of dismantling.<br />
Provision for Pensions and Other Postretirement<br />
Benefits (OPEB)<br />
This provision includes the unfunded accrued<br />
pension benefit related to the health care plan and<br />
the insured pension plan. The determination of this<br />
provision is based on an independent actuarial<br />
evaluation.<br />
Provision for Environmental Risk<br />
Liabilities related to future remediation costs are<br />
recorded when environmental assessments or<br />
cleanups or both are probable and the costs can be<br />
reasonably estimated.<br />
According to Staatsolie’s policy, which is based<br />
on international accepted Environmental, Health
Annual REPORT<br />
Confidence in Our Own Abilities 45<br />
and Safety (EHS) standards for petrol stations and<br />
national regulations (NIMOS), an environmental<br />
provision is recorded for GOw2 Energy Suriname<br />
N.V.. The environmental provision is measured<br />
at the expected value of future cash flows. The<br />
expected value is not discounted to their present<br />
value, because the discounted present value does<br />
not significantly deviate from the expected value.<br />
Earnings per Share<br />
Since Staatsolie has a simple capital structure<br />
with no potential common shares, only the basic<br />
earnings per share (EPS) applies. The calculation<br />
is based on income available to common<br />
stockholders divided by the weighted –average<br />
number of common shares outstanding during<br />
the period.<br />
Revenues<br />
Revenues consist of the sales of petroleum<br />
products, electric energy and trade activities<br />
of petroleum products. Petroleum products are<br />
generally being sold under short‐term agreements<br />
at prevailing market prices. In some cases,<br />
products may be sold under long‐term agreement<br />
with periodic price adjustments. Revenues are<br />
recognized when products are delivered, which<br />
occurs when the customer has taken title and<br />
has assumed the risks and rewards of ownership,<br />
prices are fixed or determinable and collectibility<br />
is reasonably assured.<br />
The difference between the opening and closing<br />
inventory balance of finished products for sale as<br />
well as for internal use is recorded as ‘Inventory<br />
variation’.<br />
Expenditures<br />
Expenditures are recognized in the year incurred.<br />
All costs relating to production, including<br />
maintenance and repair of production equipment,<br />
are accounted for as production costs (‘lifting<br />
costs’), and are expensed as incurred.<br />
The costs of the trading activities and electric<br />
energy are recorded as ‘other operational costs’.<br />
Income Tax<br />
Income tax expense comprises both corporation tax<br />
and deferred tax. Income taxes are computed on the<br />
financial results as shown in the income statement.<br />
2 Accounting Standards<br />
and Interpretations<br />
The consolidated financial statements are prepared<br />
in accordance with US GAAP for oil and gas industries<br />
in particular. With regard to the accounting policy<br />
of Staatsolie the new standards/amendments<br />
of 2015 have been evaluated. As a result the new<br />
standards/amendments of 2015 are not applicable,<br />
or where applicable the adoption of the standards<br />
did not have a material impact on the company’s<br />
financial statements.<br />
3 Cash and cash equivalents (x US$ 1,000 unless indicated otherwise)<br />
<strong>2016</strong> 2015<br />
Cash at foreign banks 31,963 29,439<br />
Cash at local banks 6,809 23,308<br />
Total bank balance 38,772 52,747<br />
Petty cash 394 1,317<br />
39,166 54,064<br />
Cash and cash equivalents include restricted cash<br />
for a total of US$ 19.4 million. The nature of these<br />
restricted funds relates to:<br />
• Collateral with reference to Staatsolie’s long<br />
term loans and funding for interest and loan<br />
(re)payment US$ 9.4 million<br />
• Collateral with reference to the SPCS loan and<br />
funding of interest and loan (re)payment of<br />
US$ 4.4 million<br />
• Interest payable for local bondholders US$<br />
0.05 million<br />
• Corporate parent guarantees of Staatsolie<br />
to secure Ventrin’s operational activities<br />
US$ 5.5 million.
Annual REPORT<br />
Confidence in Our Own Abilities<br />
46<br />
4 Short‐term investments<br />
Shortterm investments pertain to investments in<br />
shares of local companies. Valuation of short‐term<br />
investments is based on level 1 inputs. These<br />
are quoted prices in active markets for identical<br />
assets or liabilities.<br />
5 Trade receivables<br />
The trade receivables amounting to US$ 108.6<br />
million (2015: US$ 118.7 million) include a provision<br />
for doubtful accounts of US$ 6,199,858 of which<br />
US$ 5,702,774 for Staatsolie and US$ 497,085 for<br />
the subsidiaries (2015: US$ 5,847,151 for Staatsolie<br />
and US$ 329,313 for the subsidiaries)<br />
6 Inventories<br />
<strong>2016</strong> 2015<br />
Petroleum products 22,785 19,944<br />
Materials and supplies (net) 41,187 43,700<br />
Ordered goods 3,170 7,860<br />
67,142 71,504<br />
Materials and supplies include a provision for obsolete items of US$ 273,829. (<strong>2016</strong>:US$ 467,726)<br />
7 Prepaid expenses and other current assets<br />
<strong>2016</strong> 2015<br />
Receivable from personnel 192 440<br />
Prepaid to Purchase agents 750 750<br />
Prepaid insurance costs 917 832<br />
Asset to be transfer 3,900 -<br />
Receivable from Surgold 8,660 -<br />
Amount due from Joint Ventures and Associates 9,719 11,040<br />
Prepaid purchased goods, services and other prepaid expenses 11,010 3,961<br />
Downpayment vendors 12,526 16,630<br />
Net sales tax receivable 20,713 18,624<br />
68,387 52,277<br />
8 Investments<br />
Investments to the amount of US$ 308,718,618<br />
(2015: US$ 227,963,754) consist of the following:<br />
Participation in Joint Ventures<br />
Uitkijk Joint Venture<br />
The participation of POC in the Uitkijk joint venture<br />
is 96.5% and amounts to US$ 12,757,051 (2015:<br />
US$ 12,757,051). The current account amounts<br />
to US$ (9,694,054) (2015: US$ (9,694,054)).<br />
This results in a balance of US$ 3,062,997 (2015:<br />
US$ 3,062,997)<br />
Participation in Suriname Gold Project CV<br />
On 14 November 2014 Staatsolie entered as limited<br />
partner with an interest of 25% into the partnership<br />
‘Suriname Gold Project C.V.’. Surgold Gold Company<br />
LLC (“Surgold”), a subsidiary of Newmont Mining<br />
Corporation, is the managing partner with a 75%<br />
interest in this partnership.The Suriname Gold Project<br />
C.V. encompasses the exploration, development and<br />
exploitation of the gold mine ‘Merian’, which is a<br />
gold deposit located in the eastern part of Suriname<br />
close to the French Guiana border. Construction of<br />
the Merian Gold project (the current mine) began<br />
after the right of exploitation was granted. Suriname<br />
Gold Project C.V. commenced commercial gold<br />
production October 1, <strong>2016</strong>.
Annual REPORT<br />
Confidence in Our Own Abilities 47<br />
Taken into account the structure and control of<br />
this partnership, Staatsolie’s interest is accounted<br />
at net equity value. The participation amounted to<br />
US$ 305,655,621 as at 31 December <strong>2016</strong> (2015:<br />
US$ 224,900,757); this includes the capitalized<br />
interest and commitment fees of US$ 12,827,328;<br />
a positive result from participating interests<br />
of US$ 8,121,000 in <strong>2016</strong> and the Government<br />
contribution amounted to US$ 63,087,065.<br />
The contribution of the Government of Suriname<br />
(GoS) is based on their intent to acquire not more<br />
than 5% of Staatsolie’s participation interest in<br />
Suriname Gold Project C.V. The contribution is<br />
recognized as a current account with GoS.<br />
9 Intangible assets<br />
<strong>2016</strong> 2015<br />
Goodwill 5,447 5,447<br />
Other Intangible assets 8,434 12,047<br />
Balance as at December 31 13,881 17,494<br />
Goodwill<br />
Staatsolie tested the goodwill paid in relation to<br />
the acquisition of GOw2 for impairment in <strong>2016</strong><br />
and concluded no impairment was necessary.<br />
Other Intangible Assets<br />
This regards capitalized computer software and is<br />
amortized on a straightline basis over a period of 5<br />
years.<br />
10 Deferred tax assets<br />
Movements in <strong>2016</strong> in the deferred tax (assets)/liabilities were as follows:<br />
<strong>2016</strong> 2015<br />
Balance as at January 1 10,119 8,149<br />
Movement due to:<br />
Difference between commercial and fiscal calculation of profit - 44<br />
Unrealized losses on inventory subsidiaries - (998)<br />
Unrealized financial gains/ (losses) from investment in pension plan and postretirement 2,360 2,261<br />
Unrealized financial gains/ (losses) from Shares 1,136 663<br />
Adjustments previous years 2,447 -<br />
Balance as at December 31 16,062 10,119<br />
The deferred tax assets as of 31 december <strong>2016</strong> is as follows:<br />
(x US$ 1,000) Deferred Tax assets <strong>2016</strong> Taxable amount Deferred tax<br />
Pensions and other postretirement benefit plans 46,601 16,754<br />
Unrealized (gains) and losses short‐term investments (1,921) (692)<br />
Total (44,680) (16,062)
Confidence in Our Own Abilities<br />
48<br />
Annual REPORT<br />
11 Loan receivables<br />
In accordance with the Power Purchase<br />
Agreement dated March 1, 2013 (with latest<br />
amendment in April <strong>2016</strong>) by and between SPCS<br />
and the Government of Suriname (GoS), SPCS<br />
constructed a transmission line to the grid of<br />
EBS. The aggregated cost of US$ 26.81 million<br />
was divested in favor of GOS in January <strong>2016</strong>, and<br />
accordingly derecognized in the books of SPCS. As<br />
of December 31, <strong>2016</strong>, a total of US$ 3.77 million<br />
was repaid by GoS. The short term portion of this<br />
loan amounts to US$ 8,367,586 and the long term<br />
portion amounts to US$ 14,676,623. The interest<br />
rate of this loan is 5.76% p.a., and repayment of the<br />
term loan is planned for six(6) quarterly installment<br />
with maturity date of November 2021.<br />
12 Property, plant and equipment<br />
Movements in <strong>2016</strong> in property, plant and equipment are as follows:<br />
<strong>2016</strong> 2015<br />
Upstream Refining Marketing<br />
Power plant<br />
Corporate<br />
Projects in<br />
Total<br />
Total<br />
& trading<br />
& other<br />
progress<br />
tangible fixed<br />
tangible fixed<br />
assets<br />
assets<br />
Investments January 1 763,863 1,133,681 46,703 128,563 56,910 205,166 2,334,886 2,099,470<br />
Disinvestments<br />
current year<br />
Capitalized from PIP to<br />
PPE current year<br />
Addition/Internal<br />
transfer<br />
(61) (1,771) (3) (1,587) (3,368) (26,810) (33,600) (2,296)<br />
59,272 24,853 359 4,156 145 (80,954) 7,830 (16,947)<br />
90 1 171 58 79 37,191 37,590 281,960<br />
Expensed to P&L - - - - - (2,453) (2,453) (27,300)<br />
Total investments<br />
December 31<br />
Total depreciation<br />
January 1<br />
Depreciation<br />
disinvestment/<br />
internal transfer<br />
current year<br />
Depreciation<br />
current year<br />
Total depreciation<br />
value December 31<br />
Book value as at<br />
December 31<br />
823,164 1,156,762 47,230 131,190 53,766 132,140 2,344,252 2,334,887<br />
(450,690) (110,230) (35,730) (21,600) (16,470) - (634,720) (568,737)<br />
60 1,771 - 384 981 - 3,196 705<br />
(36,004) (49,151) (1,399) (8,802) (1,096) - (96,452) (66,688)<br />
(486,634) (157,610) (37,129) (30,018) (16,585) - (727,976) (634,720)<br />
336,530 999,152 10,101 101,172 37,181 132,140 1,616,276 1,700,167<br />
Investment in Evaluated Properties<br />
The <strong>2016</strong> depreciation rate of 0.08 (2015: 0.08)<br />
for the Tambaredjo Field, 0.08 for the Calcutta<br />
Field (2015: 0.08) and 0.12 (2015: 0.12) for the<br />
Tambaredjo North‐West Field are based on the<br />
Unit of Production Method, which is calculated by<br />
using the quotient of the <strong>annual</strong> production and<br />
the proved developed reserve, plus the production<br />
in the current fiscal year.<br />
Staatsolie’s oil producing properties are primarily<br />
obtained through concessions provided by the<br />
Surinamese government. They have also been<br />
acquired through a decree in land lease or through<br />
the purchase of the right of land lease. Regarding<br />
these concessions, the government decided by<br />
decree in June 1988 that there will be no retribution<br />
on the produced oil from the Staatsolie oil fields.
Annual REPORT<br />
Confidence in Our Own Abilities 49<br />
Asset retirement obligations/Provision for dismantlement and abandonment<br />
The following table summarizes the accretion related activity in the liability for asset retirement obligations:<br />
<strong>2016</strong> 2015<br />
Balance as at January 1 122,606 109,464<br />
Accretion expense 7,277 6,568<br />
Addition subject to depreciation 3,050 6,574<br />
Balance as at December 31 132,933 122,606<br />
Upstream assets comprise the following:<br />
<strong>2016</strong> 2015<br />
Land & Leasehold Improvement 9,276 7,357<br />
Building & Structure 20,407 20,359<br />
Machinery & Equipment 52,731 50,800<br />
Abondonment cost 5,453 2,448<br />
Well & Equipment 719,188 666,793<br />
Pipelines 11,264 11,264<br />
Other fixed assets 4,845 4,842<br />
823,164 763,863<br />
Less : accumulated depreciation (486,634) (450,689)<br />
Total assets dowmstream 336,530 313,174<br />
Suspended Exploratory Well Costs<br />
The amount of capitalized exploratory well costs<br />
that is pending the determination of proved<br />
reser ves. The following two tables provide<br />
details of the changes in the balance of suspended<br />
exploratory well costs as well as an aging summary<br />
of those costs.<br />
Change in capitalized suspended exploratory well costs<br />
<strong>2016</strong> 2015<br />
Balance as at January 1 69,319 26,286<br />
Additions pending determination of proved reserves 755 43,173<br />
Charged to expense (92) (140)<br />
Balance as at December 31 69,982 69,319<br />
Period end capitalized suspended exploratory well costs<br />
<strong>2016</strong> 2015<br />
Capitalized for a period of one year or less 663 39,352<br />
Capitalized for a period between one and two years 39,353 5,697<br />
Capitalized for a period between two and three years 29,966 24,270<br />
Capitalized for a period greater than one year ‐ subtotal 69,319 29,967<br />
Balance as at December 31 69,982 69,319
Annual REPORT<br />
Confidence in Our Own Abilities<br />
50<br />
Exploration activity often involves drilling multiple<br />
wells, over a number of years, to fully evaluate a<br />
project. The table below provides a breakdown<br />
of the number of projects with the suspended<br />
exploratory well costs which had their first<br />
capitalized well drilled in the preceding 12 months<br />
and those that have had exploratory well costs<br />
capitalized for a period greater than 12 months.<br />
Breakdown of number of projects with suspended exploratory well cost<br />
<strong>2016</strong> 2015<br />
Number of projects that have exploratory well costs capitalized for a period greater than<br />
12 months<br />
3 6<br />
Total 3 6<br />
Refinery<br />
The refinery assets are depreciated on a<br />
straight‐line basis. As of December 2015 the<br />
refinery has reached substantial completion. The<br />
refinery units and the distributed control system<br />
are depreciated at respectively 4.3% and 20%<br />
<strong>annual</strong>ly. The tank farm consist of new storage<br />
tanks and tanks which have been upgraded. The<br />
depreciaton rates are 4.3% and 20% per year. Land<br />
is not depreciated.<br />
Refinery assets comprise the following:<br />
<strong>2016</strong> 2015<br />
Land and leasehold improvement 9,774 9,774<br />
Building & Structure 1,102,875 1,080,411<br />
Machinery & Equipment 6,073 5,466<br />
Abandoment Cost 6,778 6,778<br />
Pipeline 28,820 28,820<br />
Other Fixed assets 2,442 2,432<br />
1,156,762 1,133,681<br />
Less: accumulated depreciation (157,610) (110,230)<br />
Total refinery assets 999,152 1,023,451<br />
Marketing & trading assets comprise the following:<br />
<strong>2016</strong> 2015<br />
Building & Structure 3,376 3,376<br />
Machinery & Equipment 6,516 6,516<br />
Pipeline 4,429 4,429<br />
Other Fixed assets 135 135<br />
GOw2 27,943 27,586<br />
Ventrin 4,831 4,661<br />
47,230 46,703<br />
Less: accumulated depreciation (37,129) (35,730)<br />
Total for Marketing & Trading 10,101 10,973
Annual REPORT<br />
Confidence in Our Own Abilities 51<br />
Power Plant<br />
The power plant assets are depreciated on a<br />
straight‐line basis. The buildings and production<br />
hall are depreciated at respectively 5% and<br />
10%, inventory at 33 1 / 3 %, tank batter y at 20%,<br />
powerhouse equipment at 5% to 50%, other units<br />
are depreciated at 5% to 20% <strong>annual</strong>ly. Yard is not<br />
depreciated.<br />
Power plant’s assets comprise the following:<br />
<strong>2016</strong> 2015<br />
Land & Leasehold improvement 300 300<br />
Building & Structure 21,042 21,042<br />
Machinery & Equipment 107,874 105,305<br />
Abandoment Cost 1,796 1,751<br />
Other Fixed Assets 178 165<br />
131,190 128,563<br />
Less: accumulated depreciation (30,018) (21,600)<br />
Total power plant assets 101,172 106,963<br />
Corporate & Other Fixed Assets<br />
Land and Freehold estates are not depreciated.<br />
Other properties, outside the production field<br />
are being amortized on a straight‐line basis. The<br />
<strong>annual</strong> depreciation percentage for buildings<br />
is 10%, telecommunication equipment 20%,<br />
dock TLF 4% and oil tanker 10%. Drilling machinery<br />
and heavy equipment are depreciated <strong>annual</strong>ly<br />
at 20%, transportation equipment at 33 1 / 3 % and<br />
office furniture, fixtures and similar assets at 50%.<br />
Where applicable a residual value is taken into<br />
consideration.<br />
Other fixed assets comprise the following:<br />
<strong>2016</strong> 2015<br />
Land & Leasehold Improvement 34,024 36,510<br />
Buildings and installations 6,536 6,515<br />
Other Fixed Assets 13,206 13,885<br />
53,766 56,910<br />
Less: accumulated depreciation (16,585) (16,470)<br />
37,181 40,440<br />
13 Accrued Liabilities<br />
<strong>2016</strong> 2015<br />
Allowances payable to management and personnel 3,907 1,676<br />
Payables regarding consultancy and other services 4,561 15,081<br />
Accrued interest 9,220 7,755<br />
REP accruals - 26,399<br />
Payables in connection with land 4,438 4,438<br />
Current account GoS 64,916 -<br />
87,042 55,349<br />
The current account GoS consists of the<br />
Government’s contribution and amounts to US$<br />
63 million. The contribution of the Government of<br />
Suriname is based on their intent to acquire not<br />
more than 5% of Staatsolie’s participation interest in<br />
Suriname Gold Project C.V. Furthermore an amount<br />
of US$ 1.8 million was received as royalties which<br />
was transferred to the Government in 2017.
Annual REPORT<br />
Confidence in Our Own Abilities<br />
52<br />
14 Income and other taxes payable<br />
<strong>2016</strong> 2015<br />
Income tax 11,739 3,682<br />
Payroll taxes and social security 2,835 9,437<br />
Sales tax 1,440 -<br />
16,014 13,119<br />
15 Bond<br />
The five‐year 7% unsecured coupon bond matured<br />
on May 14, 2015. On this day Staatsolie issued a<br />
second five‐year 7.75% unsecured coupon bond<br />
and raised US$ 99.1 million. The maturity date of<br />
this second bond is may 14, 2020. Interest will be<br />
paid semi‐<strong>annual</strong>ly on May 14 and November 14<br />
each year.<br />
As of December 31, <strong>2016</strong>, unamortized debt<br />
arrangement fees amounted to US$ 0.7 million.<br />
The amortization of debt arrangement fees for<br />
<strong>2016</strong> amounted US$ 0.2 million and is presented<br />
under financial expenses under the company’s<br />
income statement.<br />
16 Loans<br />
DSB Loan Facility<br />
This regards a bullet loan of € 8.7 million obtain<br />
in June <strong>2016</strong>. The maturity date of the loan is 30<br />
December 2017. The interest is being paid on a<br />
quarterly basis. A parcel of land was given as a<br />
collateral to the bank.<br />
Secured Long‐Term Loan<br />
On September 28, 2015 Staatsolie refinanced the<br />
Corporate loan for the total amount of US$ 600<br />
million. The total loan amount consists of US$ 575<br />
million term loan and US$ 25 million revolving<br />
loan. Repayment of theterm loan is planned for 13<br />
quarterly installments, to commence in the fourth<br />
quarter of <strong>2016</strong>. On November 16, <strong>2016</strong> Staatsolie<br />
refinanced and prepaid the Corporate loan for the<br />
total amount of US$ 294 million. This prepayment<br />
included the first quarterly installment of <strong>2016</strong>.<br />
The outstanding Corporate loan as of December<br />
31, <strong>2016</strong> amounted to US$ 306 million. The<br />
outstanding amount consists of US$ 281 million<br />
term loan and US$ 25 million revolving loan.<br />
Repayment of the term loan is planned for 13<br />
quarterly installments. A new amortization<br />
schedule is agreed and the last repayment is due<br />
in November 2019 with a bullet payment.<br />
With regard to the term loan, the financial institutions<br />
required security for Staatsolie’s payment<br />
obligations. The security mainly consists of the<br />
offshore receivables and the receivables out of the<br />
Merian Gold Project. Staatsolie also has to comply<br />
with several affirmative and negative covenants. As<br />
of December 31, <strong>2016</strong> Staatsolie is in compliance<br />
with the covenants of the loan agreement.<br />
Debt arrangement fees incurred, amounted to<br />
US$ 0.9 million in <strong>2016</strong> (2015: US$ 3.8 million). As of<br />
December 31, <strong>2016</strong>, unamortized debt arrangement<br />
fees amounted to US$ 10.0 million (2015: US$ 12.3<br />
million). The amortization of debt arrangement fees<br />
for <strong>2016</strong> amounted US$ 3.2 million (2015: US$ 2.9<br />
million) and is presented under financial expenses<br />
under the company’s income statement.<br />
Loan SPCS<br />
In September 2013, SPCS closed a seven (7) year<br />
term loan with Credit Suisse for the expansion of<br />
the power plant. November 17 2014, SPCS restated<br />
and amended its credit agreement of US$ 74 million<br />
to US$ 120 million. The outstanding loan as of<br />
December 31, <strong>2016</strong> amounted to US$ 100 million.<br />
With a grace period of 4 quarters, a total of US$ 20<br />
million was repaid in <strong>2016</strong>. Repayment of the loan is<br />
planned for 24 quarterly installments. The maturity<br />
date of the loan is in November, 2021.<br />
Staatsolie acts as guarantor for this loan and will<br />
make the repayments in US dollars. As collateral<br />
the bank requested 100% of SPCS’s fixed assets, all<br />
rights and benefits gained in the Power Purchase<br />
Agreement (PPA) as well as the establishment of<br />
various offshore collateral accounts.<br />
As of December 31, <strong>2016</strong>, unamortized debt<br />
arrangement fees amounted to US$ 2.23 million<br />
(2015: US$ 2.69 million). The amortization of debt<br />
arrangement fees for <strong>2016</strong> amounted to US$ 0.5<br />
million (2015: US$ 0.5 million) and is presented<br />
under financial expenses in the company’s income<br />
statement.
Annual REPORT<br />
Confidence in Our Own Abilities 53<br />
Loan Government of Suriname<br />
In november <strong>2016</strong> Staatsolie refinanced the secured<br />
long term bank loan with an unsecured loan from<br />
the government of Suriname. The loan amounts<br />
to US$ 261 million and bears 9.25% interest and a<br />
bullet repayment in november 2026.<br />
17 Provision for dismantlement and abandonment<br />
Provision for dismantlement and abandonment comprises the following:<br />
<strong>2016</strong> 2015<br />
Production field in <strong>2016</strong>: 1,789 wells (2015: 1,729 wells) 108,782 99,936<br />
Production facilities: Saramacca and pipeline to TLF 10,161 9,636<br />
Refinery 11,593 10,814<br />
Power plant 2,397 2,220<br />
132,933 122,606<br />
18 Provision for pensions & other postretirement benefits<br />
<strong>2016</strong> 2015<br />
Unfunded accrued pension benefits, insured pension plan 596 626<br />
Unfunded accrued pension benefits, health care plan 15,441 10,116<br />
16,037 10,742<br />
19 Provision for pension plan<br />
The provision for pension plan to the amount of<br />
US$ 34,233,686 (2015: US$ 31,803,033) includes<br />
an amount of US$ 112,324 (2015: US$ 129,342)<br />
for GOw2 Energy Suriname and US$ 34,121,362<br />
(2015: US$ 31,673,691) regarding the accrued<br />
pension cost related to the pension plan for<br />
Staatsolie employees, which is managed by the<br />
‘Stichting Pensioenfonds voor Werknemers van<br />
Staatsolie Maatschappij Suriname N.V.’.<br />
Pensions and other Postretirement Benefits<br />
Staatsolie maintains 3 plans with regard to pensions<br />
and postretirement benefits:<br />
• The pension plan for employees, which is<br />
managed by the ‘Stichting Pensioenfonds voor<br />
Werknemers van Staatsolie Maatschappij<br />
Suriname N.V.’;<br />
• The insured pension plan;<br />
• The unfunded health care benefit plan for<br />
retired personnel.
Annual REPORT<br />
Confidence in Our Own Abilities<br />
54<br />
The benefit obligation and plan assets associated with the benefit plans are measured on December 31, as follows:<br />
Pension benefits Insured pension benefits Postretirement health care<br />
<strong>2016</strong> 2015 <strong>2016</strong> 2015 <strong>2016</strong> 2015<br />
Benefit obligation as at<br />
December 31<br />
Fair value of plan assets as at<br />
December 31<br />
Funded status as at<br />
December 31<br />
(139,070) (124,930) (596) (626) (21,834) (16,165)<br />
104,949 93,256 - - 6,393 6,049<br />
(34,121) (31,674) (596) (626) (15,441) (10,116)<br />
(in %) Pension benefits Insured pension benefits Postretirement health care<br />
Actuarial assumptions <strong>2016</strong> 2015 <strong>2016</strong> 2015 <strong>2016</strong> 2015<br />
Price inflation 3.00 3.00 3.00 3.00 3.00 3.00<br />
Actuarial discount rate 4.50 4.50 4.50 4.50 4.50 4.50<br />
Expected return on plan assets 6.50 6.50 - - 6.50 6.50<br />
Adjustment for inflation and<br />
salary developments<br />
3.00 3.00 3.00 3.00 - -<br />
Average Merit 1.50 1.50 1.50 1.50 - -<br />
Rate of benefit increase 2.50 2.50 - - - -<br />
Expected increase medical cost - - - - 5.00 5.00<br />
The measurement of the accumulated<br />
postretirement benefit obligation assumes an<br />
initial health care cost trend rate of 5.0 percent. A<br />
one percentage point increase in the health care<br />
cost trend rate would increase service and interest<br />
cost by US$ 0.6 million and the accumulated<br />
postretirement benefit obligation by US$ 5.1<br />
million (2015: US$ 3.9 million). A one percentage<br />
point decrease in the health care cost trend rate<br />
would decrease service and interest cost by US$<br />
0.5 million and the accumulated postretirement<br />
benefit obligation by US$ 3.9 million (2015: US$ 3.0<br />
million).<br />
Pension benefits Health care<br />
<strong>2016</strong> 2015 <strong>2016</strong> 2015<br />
Employer's contribution (4,990) (4,539) - -<br />
Employee's contribution (1,663) (1,513) - -<br />
Benefits paid 947 747 103 86
Annual REPORT<br />
Confidence in Our Own Abilities 55<br />
Pension benefits<br />
Insured pension benefits<br />
Postretirement<br />
health care<br />
As at December 31 2015 <strong>2016</strong> 2017 2015 <strong>2016</strong> 2017 2015 <strong>2016</strong> 2017<br />
Service costs (5,719) (6,447) (7,158) (27) (32) (28) (1,005) (907) (1,249)<br />
Interest costs (4,816) (5,622) (6,258) (24) (28) (27) (800) (722) (975)<br />
Return on assets 5,696 6,236 7,007 - - - 367 393 416<br />
Unrecognized transition costs (21) (21) (21) - - - (121) (121) (121)<br />
Unrecognized prior service (176) (176) (176) - - - - - -<br />
Unrecognized gains/(losses) (1,170) (1,611) (1,596) 57 49 63 - 14 (17)<br />
Net pension costs (6,206) (7,641) (8,202) 6 (11) 8 (1,559) (1,343) (1,946)<br />
Pension benefits Insured pension benefits<br />
Post retirement<br />
health care<br />
Change in Benefit Obligation <strong>2016</strong> 2015 <strong>2016</strong> 2015 <strong>2016</strong> 2015<br />
Benefit obligation as at January 1 (124,930) (107,023) (626) (526) (16,166) (17,892)<br />
Service costs (6,447) (5,718) (32) (28) (906) (1,005)<br />
Interest cost (5,622) (4,816) (28) (24) (722) (800)<br />
Benefits 947 747 90 - 112 166<br />
Actuarial gains/(losses) (3,018) (8,120) - (48) (4,152) 3,366<br />
Benefit obligation as at<br />
December 31<br />
(139,070) (124,930) (596) (626) (21,834) (16,165)<br />
Pension benefits<br />
Post retirement<br />
health care<br />
Change in Plan Assets <strong>2016</strong> 2015 <strong>2016</strong> 2015<br />
Fair value of plan assets as at January 1 93,257 84,981 6,049 5,648<br />
Contributions 7,569 6,129 230 228<br />
Benefits paid (947) (747) (103) (86)<br />
Actual return on assets 5,070 2,893 217 260<br />
Fair value of plan assets at December 31 104,949 93,256 6,393 6,050
Annual REPORT<br />
Confidence in Our Own Abilities<br />
56<br />
Pension benefits Insured pension benefits<br />
Post retirement<br />
health care<br />
Change in Other<br />
Comprehensive Income<br />
Change in Other Comprehensive<br />
IncomeJanuary 1<br />
<strong>2016</strong> 2015 <strong>2016</strong> 2015 <strong>2016</strong> 2015<br />
41,604 32,049 (429) (534) (1,132) 2,248<br />
Unrecognized Transition Cost (21) (21) - - (121) (121)<br />
Unrecognized Prior Service Costs (176) (176) - - - -<br />
Unrecognized Gains/ (Losses) (1,611) (1,170) 49 57 14 -<br />
Gains/ (Losses) 4,184 10,922 (90) 48 4,329 (3,259)<br />
Other comprehensive income<br />
at December 31<br />
43,980 41,604 (470) (429) 3,090 (1,132)<br />
The strategy of the ‘Stichting Pensioenfonds’ for<br />
investing the plan assets into the different asset<br />
classes is based on the guidelines of the ‘Centrale<br />
Bank van Suriname’, prescribing maximum<br />
thresholds for certain asset categories. The 2015<br />
fair value of the benefit plan assets, including the<br />
level within the fair value hierarchy, is shown below.<br />
Plan Assets<br />
The <strong>2016</strong> fair value of the Pension benefit plan<br />
assets, including the level within the fair value<br />
hierarchy, is shown in the table below:<br />
%<br />
Level 1<br />
Quoted prices in<br />
active markets for<br />
identical assets or<br />
liabilities<br />
Level 2<br />
Significant other<br />
observable inputs<br />
Level 3<br />
Significant<br />
unobservable<br />
inputs<br />
1 Real estate: 44,499 42 - 44,499 -<br />
2 Equity Securities: 19,761 19 -<br />
Shares 6,878 6,503 375 -<br />
Trust Companies 1,279 1,279 - -<br />
Term deposits 11,404 11,404 - -<br />
Other 200 - - 200<br />
3 Debt Securities:<br />
Corporate Bonds 3,400 3 3,000 400 -<br />
4 Mortgage Loans: 28,013 27 - 28,013 -<br />
5 Cash and Cash Equivalents*) 5,960 6 5,960 - -<br />
6 Other current assets 3,316 3 - - 3,316<br />
104,949 100 28,146 73,287 3,516
Annual REPORT<br />
Confidence in Our Own Abilities 57<br />
The valuation techniques used to measure the fair<br />
value of the plan assets are as follows:<br />
1. Real estate, fair value is based on appraised<br />
values established by a certified appraiser<br />
using comparable market oriented prices.<br />
The real estate categorized as level 2, is<br />
derived from the data regarding the profile<br />
and marketability of the investment.<br />
2. Equity securities, measurement of fair<br />
value depends on the type of investment:<br />
Shares and investments in trust companies,<br />
are based on quoted prices, derived from<br />
active security exchanges market. The term<br />
deposits are highly marketable. The shares,<br />
categorized as level 2, are valued with input<br />
other than quoted prices that are observable<br />
for the investment. Other, is treated as a level<br />
3, which is derived from the data regarding<br />
the profile and status of this investment.<br />
3. Corporate bonds, valued as level 1 is based on<br />
quoted prices derived from active exchange<br />
markets and the level 2 is established by<br />
other than quoted prices that are observable<br />
for these bonds.<br />
4. Mortgage loans, fair value is based on<br />
appraised values of collateral established<br />
by a certified appraiser using comparable<br />
market oriented prices.<br />
*) Cash and Cash equivalents are valued at face<br />
value which is equal to the fair value.<br />
20 Provision for Environmental Risk<br />
In 2011 GOw2 Energy Suriname N.V. took over<br />
the Chevron marketing activities of Chevron in<br />
Suriname, which included 22 petrol stations and 3 oil<br />
terminals. Currently the sites have to be remediated<br />
and the estimated cost is US$ 3,016,463.<br />
of earnings available to common stockholder and 5<br />
million weighted average number of common shares<br />
outstanding year to date.<br />
22 Segments and related information<br />
Staatsolie’s business covers integrated activities<br />
regarding the oil and energy industry. These<br />
activities are defined into the following operating<br />
segments: upstream, downstream, trading and<br />
energy. As defined in the accounting standard<br />
for segment reporting ASC 280, these operating<br />
segments are the Company’s reportable segments.<br />
The upstream is responsible for exploring,<br />
developing, producing and transporting crude oil<br />
to the refinery. The downstream is organized and<br />
operates to refine the crude oil, market, sell, and<br />
distribute the oil products. The trading segment<br />
involves trading fuel products and selling these<br />
products to wholesale and retail as well as bunkering<br />
customers.<br />
The energy segment operates the 96 megawatt<br />
thermal power plant and delivers the electric<br />
power to the single source customer, the national<br />
electricity company EBS, for further distribution.<br />
These functions have been defined as the operating<br />
segments of the Company because they are the<br />
segments (1) that engage in business activities<br />
from which revenues are earned and expenses are<br />
incurred; (2) whose operating results are regularly<br />
reviewed by the board of executive directors to<br />
make decisions about resources to be allocated to<br />
the segment and assess its performance; and (3) for<br />
which discrete financial information is available. The<br />
corporate segment consists of Petroleum Contracts,<br />
Business Development, Suriname Gold Project C.V.<br />
and all other corporate administrative functions.<br />
21 Earnings per Share<br />
The basic earnings per share of common stock<br />
amount to US$ 1.04 (<strong>2016</strong>) and US$ 4.60 (2015),<br />
based on US$ 5,221,921 (2015: US$ 23,013,337)
Annual REPORT<br />
Confidence in Our Own Abilities<br />
58<br />
Segment reporting Staatsolie<br />
Segment (Revenues) x US$ 1,000 <strong>2016</strong> 2015<br />
Upstream 181,571 243,220<br />
Refining & Marketing 264,965 284,533<br />
Trading 184,003 347,683<br />
Energy 49,561 53,909<br />
Total Segment amounts 680,100 929,345<br />
All Corporate activities (including eliminations) (311,808) (338,043)<br />
Total consolidated amounts 368,292 591,302<br />
Segment (Profit/ (Loss)) <strong>2016</strong> 2015<br />
Upstream 93,165 134,639<br />
Refining & Marketing (55,264) 178,577<br />
Trading 4,524 2,472<br />
Energy 7,519 39,236<br />
Total Segment amounts 49,944 354,924<br />
All Corporate activities (including eliminations) (44,722) (331,910)<br />
Total consolidated amounts 5,222 23,014<br />
Segment (Assets) <strong>2016</strong> 2015<br />
Upstream 478,014 525,507<br />
Refining & Marketing 1,163,365 1,118,124<br />
Trading 66,978 79,282<br />
Energy 152,163 156,027<br />
Total Segment amounts 1,860,520 1,878,940<br />
All Corporate activities (including eliminations) 404,518 382,034<br />
Total consolidated amounts 2,265,038 2,260,974<br />
Major Customers<br />
Revenues from one customer of the downstream<br />
segment represent approximately US$ 41.0 million<br />
(2015: US$ 74.3 million) of the Company’s<br />
consolidated revenues.<br />
23 Off‐balance commitments and contingencies<br />
xUS$1,000 2017 2018-2021 Total<br />
Long term (sales) contracts 29,088 4,131 33,219<br />
Long term downstream contracts 2,160 2,160 4,320<br />
Operational lease 6,764 4,118 10,882<br />
Claims 610 - 610<br />
Study grants 372 567 939<br />
Corperate social investments 15 - 15<br />
Other contracts 1,016 318 1,334
Annual REPORT<br />
Confidence in Our Own Abilities 59<br />
24 Revenues per product<br />
<strong>2016</strong> 2015<br />
x 1,000 Bbls x US$ 1,000 x 1,000 Bbls x US$ 1,000<br />
Local refined products (gross) 5,743 259,800 5,845 284,533<br />
Intercompany sales (2,127) (103,464) (1,247) (54,079)<br />
Local refined products (net) 3,616 156,336 4,598 230,454<br />
Trading activities 2,368 169,953 3,025 301,181<br />
Electric energy *) 39,035 50,897<br />
5,984 365,324 7,623 582,532<br />
Other sales related revenue<br />
‐ inventory change oil stock (868) 8,562<br />
‐ other revenues 3,836 208<br />
Total gross revenues 5,984 368,292 7,623 591,302<br />
25 Depreciation/Amortization<br />
The breakdown of the depreciation expenses is as follows:<br />
<strong>2016</strong> 2015<br />
Upstream 36,004 28,341<br />
Refinery 49,151 24,280<br />
Marketing & Trading 1,401 1,279<br />
Power plant 8,801 5,047<br />
Corporate & Other 1) 4,709 7,721<br />
100,066 66,668<br />
1) includes the amortization of intangible assets of US$ 3,614,603 in <strong>2016</strong>.(2015 US$ ‐)<br />
26 Trading & Other operational costs<br />
The breakdown of the trading & other operational costs is as follows:<br />
<strong>2016</strong> 2015<br />
Trading activities Staatsolie 11,951 77,244<br />
Electric energy 3,452 5,997<br />
Paradise Oil Company - 540<br />
Trading activities Ventrin 30,113 32,460<br />
GOw2 Energy Suriname 35,616 156,070<br />
81,132 272,311
Annual REPORT<br />
Confidence in Our Own Abilities<br />
60<br />
27 Financial (expenses)/ income<br />
The breakdown of the financial (expenses) and income is as follows:<br />
<strong>2016</strong> 2015<br />
Interest income 1,232 404<br />
Interest expense (42,797) (22,037)<br />
(Loss)/Gain on foreign currencies transactions 7,312 (731)<br />
(34,253) (22,364)<br />
28 Income tax charge<br />
The income tax comprises of:<br />
<strong>2016</strong> 2015<br />
Current tax expense or benefit (7,508) (5,865)<br />
(7,508) (5,865)<br />
Reconciliation statutory with effective tax rate: <strong>2016</strong> 2015<br />
Suriname statutory income tax rate 36% 36%<br />
Effect of unrecognized tax credits 22% (16%)<br />
Effective tax rate 58% 20%<br />
Tax Losses Carry Forward<br />
Ventrin has accumulated tax losses of approximately<br />
US$ 15.2 million (2015: US$ 14.5 million) available<br />
for offset against future taxable profits. These<br />
losses have no expiry date in Trinidad and Tobago.<br />
Income Tax Holiday<br />
SPCS was enjoying an income for the years 2006 up<br />
until and including 2015
Annual REPORT<br />
Confidence in Our Own Abilities 61<br />
VIII Staatsolie Separate<br />
Company Financial<br />
Statements <strong>2016</strong>
Annual REPORT<br />
Confidence in Our Own Abilities<br />
62<br />
I Company Balance Sheet as at December 31, <strong>2016</strong><br />
(<strong>2016</strong> & 2015 before distribution of earnings)<br />
Assets (xUS$ 1,000) <strong>2016</strong> 2015<br />
Current assets<br />
Cash and cash equivalents 27,784 26,762<br />
Short‐term investments 3,754 6,910<br />
Trade receivables 70,690 67,210<br />
Inventories 59,344 65,003<br />
Prepaid expenses and other current assets 152,682 92,836<br />
Loan receivable - 1,796<br />
314,254 260,517<br />
Investments<br />
Equity investment 392,084 301,139<br />
Intangible assets 13,881 17,494<br />
Deferred tax asset 16,062 10,119<br />
Property, plant and equipment<br />
Upstream 336,531 313,174<br />
Refining 999,152 1,023,453<br />
Marketing & trading 187 315<br />
Corporate & other 37,181 40,438<br />
1,373,051 1,377,380<br />
Projects in progress 127,472 173,889<br />
1,500,523 1,551,269<br />
Total assets 2,236,804 2,140,538<br />
Paramaribo, June 30, 2017<br />
The Board of Executive Directors:<br />
R. Elias Managing Director<br />
B. Dwarkasing Upstream Director<br />
A. Jagesar Downstream Deputy Director<br />
A. Moensi‐Sokowikromo Finance Director
Annual REPORT<br />
Confidence in Our Own Abilities 63<br />
x US$ 1,000 <strong>2016</strong> 2015<br />
Liabilities<br />
Current liabilities<br />
Trade payables 124,242 114,588<br />
Accrued liabilities 131,888 54,170<br />
Income and other taxes payable 6,962 5,337<br />
DSB bridge facility 9,063 -<br />
Short‐term portion of Term Loan 40,000 44,833<br />
312,155 218,928<br />
Long‐term debt<br />
Bond 98,475 98,281<br />
Term Loans 255,758 525,853<br />
GOS Loan 258,058 -<br />
Other long term liabilities 6,544 6,365<br />
618,835 630,499<br />
Provisions<br />
Dismantlement and abandonment 130,536 120,387<br />
Provision for pensions and other post retirement benefits 16,037 10,742<br />
Pension plan 34,121 31,674<br />
180,694 162,803<br />
Shareholder's equity 1,125,120 1,128,308<br />
Total Liabilities & Shareholder's equity 2,236,804 2,140,538<br />
Paramaribo, June 30, 2017<br />
The Supervisory Board:<br />
E. Boerenveen Chairman<br />
G. Asadang Member<br />
A. Imanuel Member<br />
E. Poetisi Member<br />
M. Rommy Member
Annual REPORT<br />
Confidence in Our Own Abilities<br />
64<br />
II Company Income Statement <strong>2016</strong><br />
(x US$1,000) <strong>2016</strong> 2015<br />
Revenues from<br />
Production & Refining 259,800 284,533<br />
Trading activities 20,551 76,219<br />
280,351 360,752<br />
Inventory variation (868) 8,562<br />
Other revenues 4,842 202<br />
Gross revenues 284,325 369,516<br />
Exploration expenses including dry holes (1,462) (13,946)<br />
Production expenses (44,783) (53,615)<br />
Refinery expenses (65,613) (57,998)<br />
Depreciation (86,379) (60,334)<br />
Accretion expenses (7,144) (6,465)<br />
Amortization of intangible assets (3,615) -<br />
Export‐, transport‐ and sales costs (21,768) (22,188)<br />
Trading & Other operational costs (19,932) (77,244)<br />
Operating income 33,629 77,726<br />
General and administrative expenses (21,533) (33,465)<br />
Expensed projects (1,411) (8,637)<br />
Financial income (expenses) (32,143) (20,334)<br />
Other income (expenses) 6,418 -<br />
Net income from equity investment GOw2/ SPCS 13,348 16,263<br />
Share in net result of investment Suriname Gold Project CV 8,121 (3,473)<br />
Earnings before tax 6,429 28,080<br />
Income tax charge - (3,686)<br />
Net profit 6,429 24,394<br />
Paramaribo, June 30, 2017<br />
The Board of Executive Directors:<br />
R. Elias Managing Director<br />
B. Dwarkasing Upstream Director<br />
A. Jagesar Downstream Deputy Director<br />
A. Moensi‐Sokowikromo Finance Director<br />
The Supervisory Board:<br />
E. Boerenveen Chairman<br />
G. Asadang Member<br />
A. Imanuel Member<br />
E. Poetisi Member<br />
M. Rommy Member
Annual REPORT<br />
Confidence in Our Own Abilities 65<br />
III<br />
Notes to <strong>staatsolie</strong> company balancesheet<br />
The accounting principles used for the consolidated<br />
financial statements are also applicable for the<br />
financial statements of Staatsolie.<br />
Stated below are the specific notes applicable<br />
for the financial statements regarding the equity<br />
investment and the shareholder’s equity in the<br />
balance sheet.<br />
Equity Investment<br />
Equity investments are accounted for using the<br />
equity method.<br />
Majority Interest in Affiliated Companies<br />
Ventrin Petroleum Company Limited is a wholly<br />
owned subsidiary of Staatsolie and is domiciled<br />
in the Republic of Trinidad and Tobago. In <strong>2016</strong>,<br />
Ventrin had a negative net asset value of US$<br />
6,783,821 (2015: US$ (5,579,521)) and therefore<br />
the participation was valued at nil. The net income<br />
of Ventrin in <strong>2016</strong> amounted to US$ (1,204,300)<br />
(2015: US$ (375,334)).<br />
In <strong>2016</strong>, POC has a negative net asset value of US$<br />
3,977,241 (2015: US$ (3,973,993)) and therefore<br />
the participation was valued at nil. The net loss of<br />
POC in <strong>2016</strong> amounted to US$ (3,247) (2015: US$<br />
(1,004,562)).<br />
GOw2 Energy Suriname N.V. is a wholly owned<br />
subsidiary of Staatsolie and is domiciled in<br />
Suriname. The participation in GOw2 Energy<br />
Suriname as at December 31, <strong>2016</strong> is valued at US$<br />
32,504,597 (2015: US$ 29,834,669), including the<br />
net income after tax of US$ 5,828,532 (2015: US$<br />
3,872,590).<br />
Staatsolie is the main shareholder of the Staatsolie<br />
Power Company Suriname N.V. (SPCS) and the<br />
national electricity company N.V. EBS holds one<br />
share. In <strong>2016</strong>, SPCS has a net asset value of US$<br />
53,923,416 (2015: 46,403,942) . The net income of<br />
SPCS in <strong>2016</strong> amounted to US$ 7,519,474 (2015:<br />
US$ 12,390,552).<br />
Paradise Oil Company N.V. (POC) is a wholly owned<br />
subsidiary of Staatsolie and is domiciled in Suriname.<br />
Overview of Equity investment as at December 31, <strong>2016</strong><br />
Ventrin<br />
POC<br />
GOw2<br />
Energy<br />
SPCS<br />
Suriname<br />
Share capital 13,338,977 4,000 2,639 10,300,000<br />
Retained earnings previous years (18,918,498) (3,977,994) 26,673,426 36,103,942<br />
Net earning current year (1,204,300) (3,247) 5,828,532 7,519,474<br />
Net asset value (6,783,821) (3,977,241) 32,504,597 53,923,416<br />
Minority Interest<br />
Staatsolie entered as limited partner with an interest<br />
of 25% into Suriname Gold Project LLC (‘Surgold’).<br />
Taken into account the structure and control of this<br />
partnership, Staatsolie’s interest is accounted at<br />
net equity value. Taken into account the structure<br />
and control of this partnership, Staatsolie’s interest<br />
is accounted at net equity value.<br />
The participation amounted to US$ 305,655,621<br />
as at 31 December <strong>2016</strong> (2015: US$ 224,900,757);<br />
this includes the capitalized interest and<br />
commitment fees of US$ 12,827,328 (2015: US$<br />
7,528,669).<br />
In addition a positive result from participating<br />
interests of US$ 8,121,000 (2015: US$ (3,136,000)<br />
was recorded.<br />
Shareholder’s Equity<br />
The difference between corporate and consolidated<br />
shareholder’s equity is disclosed on page 38.
Annual REPORT<br />
Confidence in Our Own Abilities<br />
66<br />
IX Other information<br />
1 Distribution of Earnings<br />
Articles of Association<br />
Distribution of earnings takes place in accordance<br />
with Article 28 of the articles of association,<br />
which stipulates that net earnings reflected in the<br />
balance sheet and income statement, adopted<br />
by the Annual General Meeting, is placed at the<br />
disposal of the General Meeting of Shareholders.<br />
<strong>2016</strong> Distribution of Consolidated Earnings<br />
In <strong>2016</strong>, a consolidated net profit of US$ 5.2<br />
million was realized. Management proposed no<br />
cash dividend, no profit sharing for management<br />
and personnel, a reserve for environmental risk<br />
and the remaining balance to be added to the<br />
general reserve.<br />
2 Adoption of Financial Statements of<br />
the Preceding Fiscal Year<br />
The 2015 Financial Statements were adopted at<br />
the General Meeting of Shareholders held on June<br />
08, <strong>2016</strong> and included Management’s proposal<br />
for the appropriation of the 2015 profit. A cash<br />
dividend of 50% amounting to US$ 7.3 million was<br />
paid.<br />
3 Subsequent Events after Balance<br />
Sheet Date<br />
• On February 16, 2017 SPCS paid an amount of<br />
US$ 6.7 million to Credit Suisse. This amount<br />
consists of US$ 5.0 million loan principal<br />
repayment and an interest payment of US$ 1.7<br />
million. On this day the Debt Service Reserve<br />
Account of SPCS was also funded. This amount<br />
consists of US$ 5.0 million.<br />
• On February 20, 2017 SPCS Engine #7 suffered<br />
a major breakdown. Failure of the Engine’s<br />
crankshaft was determined. The genset is<br />
expected to be out of service until the end of<br />
August 2017. As a result a total production<br />
potential of about 54,000MWh will not be<br />
available, corresponding with a projected loss<br />
of revenue of about US$ 7.29 million. The costs<br />
to restore the engine are estimated at US$ 2.6<br />
million. The deductible for the SPCS machinery<br />
breakdown insurance is US$ 0.5 million per<br />
occurrence.<br />
• On April 18, 2017 SPCS Engine #3 suffered<br />
a major breakdown. Damage to the engine<br />
wascaused by broken connecting rods. The<br />
genset is expected to be out of service until<br />
the end of 2017. As a result a total production<br />
potential of about 39,000MWh will not be<br />
available, corresponding with a projected loss<br />
of revenue of about US$ 5.27 million. The costs<br />
to restore the engine are not known at this<br />
time, but could be well over US$ 1 million. The<br />
deductible for the SPCS machinery breakdown<br />
insurance is US$ 0.5 million per occurrence.<br />
As of the date of these financial statements, the<br />
following subsequent events were determined for<br />
reporting purposes:<br />
• On February 16, 2017 Staatsolie N.V. paid an<br />
amount of US$ 14.6 million to Credit Suisse.<br />
This amount consists of US$ 10.0 million loan<br />
principal repayment and an interest payment<br />
of US$ 4.6 million.
Annual REPORT<br />
Confidence in Our Own Abilities 67<br />
X Five years Consolidated<br />
Income Statements<br />
(x US$ 1,000) <strong>2016</strong> 2015 2014 2013 2012<br />
Gross revenues 368,292 591,302 1,076,427 1,030,391 1,060,057<br />
Exploration expenses including dry holes (1,465) (14,157) (13,870) (14,203) (24,009)<br />
Production expenses (44,783) (53,615) (45,881) (44,471) (37,166)<br />
Refinery expenses (54,553) (54,986) (19,149) (12,943) (15,873)<br />
Depreciation/Amortization (100,066) (66,668) (44,066) (42,744) (40,652)<br />
Accretion expenses (7,277) (6,568) (5,881) (5,325) (4,875)<br />
Export‐, transport‐ and sales costs (21,768) (22,188) (34,418) (19,001) (16,466)<br />
Trading & Other operational costs (81,132) (272,311) (466,336) (412,810) (412,413)<br />
Operating income 57,248 100,809 446,826 478,894 508,603<br />
General and administrative expenses (23,509) (33,533) (33,867) (30,490) (27,968)<br />
Expensed projects (1,411) (8,637) 343 (9,759) (7,355)<br />
Financial expense and income (34,253) (22,364) (13,593) (7,005) 4,826<br />
Other income and expenses 6,534 (3,923) - - -<br />
Share in net result of investment Suriname Gold Project CV 8,121 (3,473) - - -<br />
Earnings before tax 12,730 28,879 399,709 431,640 478,106<br />
Income tax (7,508) (5,865) (123,839) (133,158) (80,390)<br />
Net profit 5,222 23,014 275,870 298,482 397,716<br />
XI Supplemental Information on<br />
Oil Producing Activities (Unaudited)<br />
In accordance with FAS 69, ‘Disclosures about<br />
oil producing activities’ Staatsolie is required<br />
to present certain supplementary information<br />
on oil exploration and producing activities. This<br />
section provides the supplemental information<br />
in five separate tables. Table 1 through table 3<br />
provide historical information regarding costs<br />
incurred in exploration, property acquisitions<br />
and development, capitalized cost regarding<br />
oil producing activities, result of operations for<br />
oil producing activities. Table 4 and 5 present<br />
information on Staatsolie’s estimated proved<br />
reserve quantities and standardized measure of<br />
estimated discounted future net cash flows related<br />
to proved reserves.<br />
1 Cost incurred in exploration, property acquisition and development for the year ended December 31, <strong>2016</strong><br />
xUS$ 1,000 <strong>2016</strong> 2015<br />
Exploration costs 1,810 30,662<br />
Development costs 63,260 102,463<br />
End of the year 65,070 133,125
Annual REPORT<br />
Confidence in Our Own Abilities<br />
68<br />
2 Capitalized Cost relating to oil producing activities as at December 31, <strong>2016</strong><br />
US$ 1,000 <strong>2016</strong> 2015<br />
Proved oil properties 809,453 673,624<br />
Accumulated depreciation (474,365) (374,399)<br />
Net capitalized costs 335,088 299,225<br />
3 Results of operations for oil producing activities for the year ended December 31, <strong>2016</strong><br />
US$ 1,000 <strong>2016</strong> 2015<br />
Revenues 280,352 360,752<br />
Production costs (44,783) (53,615)<br />
Exploration costs (1,462) (13,946)<br />
Depreciation and provisions (36,004) (35,565)<br />
198,103 257,626<br />
Income tax expenses - (3,686)<br />
Results of operations from producing activities (excl. corporate overhead interest cost) 198,103 253,940<br />
Unaudited ‐ see accompanying auditor’s report<br />
4 Reserve Quantity Information for the years ended December 31, <strong>2016</strong> and 2015<br />
Proved developed and undeveloped reserves ( x 1,000 Bbls) <strong>2016</strong> 2015<br />
Beginning of the year 83,980 99,980<br />
Revisions of previous estimates 6,220 (10,000)<br />
Production (6,000) (6,000)<br />
End of the year 84,200 83,980<br />
Proved developed reserves <strong>2016</strong> 2015<br />
Beginning of the year 60,250 66,270<br />
End of the year 60,624 60,250<br />
Proved undeveloped reserves <strong>2016</strong> 2015<br />
Beginning of the year 23,450 33,660<br />
End of the year 23,763 23,450<br />
Rounding off may lead to apparent inconsistencies<br />
Note: The oil reserves are located entirely within one geographic area in Suriname.
Annual REPORT<br />
Confidence in Our Own Abilities 69<br />
5 Standardized measure of discounted future net cash flows at December 31, <strong>2016</strong><br />
Based on the oil price of US$ 32.08<br />
<strong>2016</strong> 2015<br />
Future cash inflows (a) 2,674,591 4,852,015<br />
Future production and development costs (a) (1,208,518) (3,149,433)<br />
Future income tax expenses (a) (527,786) (638,206)<br />
Future net cash flows 938,287 1,064,376<br />
10% <strong>annual</strong> discount for estimated timing of cash flows (85,299) (468,381)<br />
Standardized measure of discounted future net cash flows 852,988 595,995<br />
(a) Future net cash flows were computed using prices used in estimating the entity’s proved oil reserves, year‐end costs, and<br />
statutory tax rates (adjusted for tax deductions) that relate to existing proved oil reserves. The Society of Petroleum Engineers<br />
guidelines propose to use the average price of <strong>2016</strong> which is 32.08 US$/BBL (2015: 42.00 US$/BBL).<br />
Unaudited ‐ see accompanying auditor’s report
Annual REPORT<br />
Confidence in Our Own Abilities<br />
70<br />
Contact<br />
Information<br />
Head Office<br />
Dr. Ir. H.S. Adhinstraat 21<br />
PO Box 4069<br />
T +597 499649<br />
F +597 491195<br />
www.<strong>staatsolie</strong>.com<br />
E info@<strong>staatsolie</strong>.com<br />
Downstream Operations<br />
Sir Winston Churchillweg 79<br />
T +597 480501<br />
F +597 480811<br />
Upstream Operations<br />
Gangaram Pandayweg km 5½<br />
T +597 375222<br />
F +597 491105<br />
Subsidiaries<br />
GOw2 Energy Suriname N.V.<br />
Van ‘t Hogerhuysstraat 27A<br />
Paramaribo | Suriname<br />
T +597 403111<br />
F +597 402116<br />
E info@gow2.com<br />
Staatsolie Power Company Suriname N.V.<br />
Sir Winston Churchillweg 79<br />
T +597 485163<br />
F +597 485178<br />
Ventrin Petroleum Company Ltd.<br />
(Trinidad and Tobago)<br />
Atlantic Plaza<br />
Port Point Lisas<br />
Couva<br />
Trinidad and Tobago<br />
T +1 868 6792962<br />
F +1 868 679 2622
www.<strong>staatsolie</strong>.com<br />
www.facebook.com/<strong>staatsolie</strong>